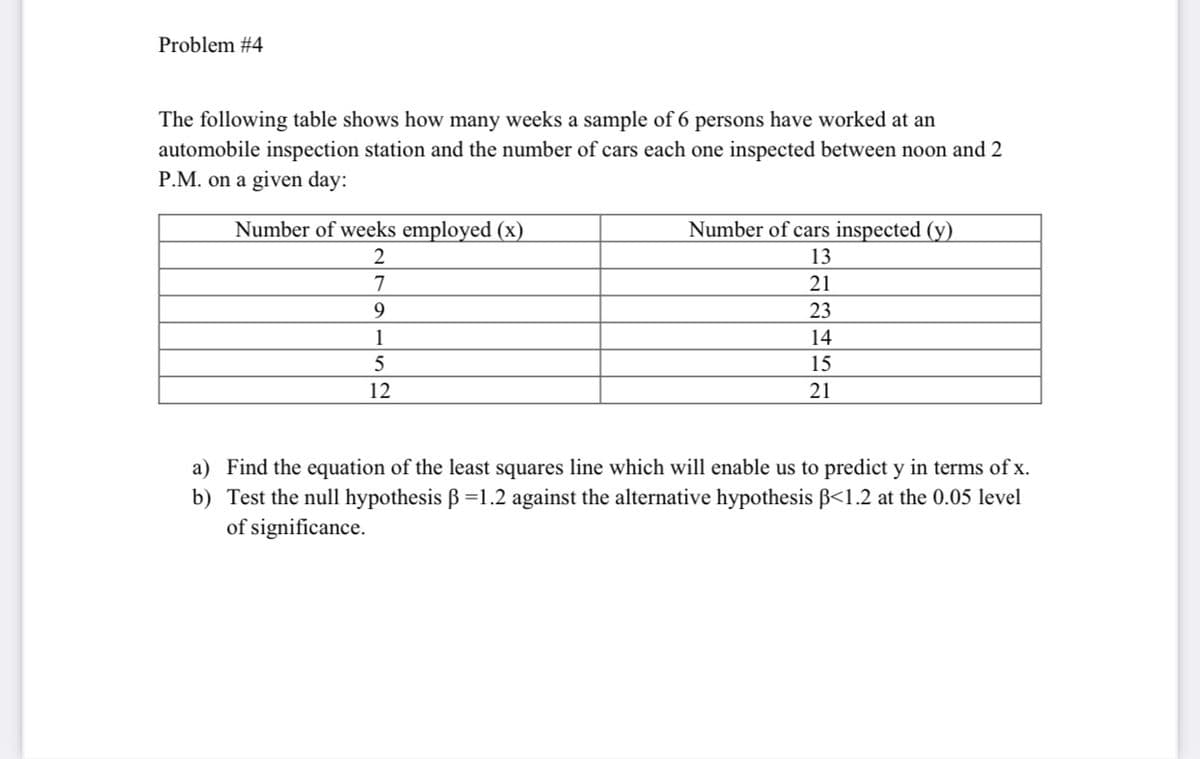
The following table shows how many weeks a sample of 6 persons have worked at an automobile inspection station and the number of cars each one inspected between noon and 2 P.M. on a given day: Number of weeks employed (x) Number of cars inspected (y) 13 7 21 23 9 1 14 15 12 21


Q: The following data give the family size (x) and number of pets per family (y) for a random samp…
A:
Q: The data shown in the following table are highway gasoline mileage performance and engine…
A: Here, we are given N = 20 The table is showing highway gasoline mileage performance (Y) and engine…
Q: A random sample of 8 car drivers insured with a business and having a similar insurance policies was…
A: Given the data table for the driving experience(in years) and the monthly car insurance premium(in R…
Q: The table shows the data gathered on the age and time in hours spent by the 30 respondents on a…
A: From the provided information, The hypotheses for this test are as follow: H0: r = 0 (There is no…
Q: Catherine is a junior reporter. As part of an investigation into consumer affairs she purchases 0.5…
A: From the provided information, The number of observations (n) = 12
Q: The data to the right represent the number of chocolate chips per cookie in a random sample of a…
A: Given: The random sample of name brand and store brand i.e, number of chocolate chips present per…
Q: Draw a scatter diagram and find r for the data shown in the table. (Round r to three decimal…
A: Given data,
Q: The following tables show the make-up of students in a school's math club. Male Female Totals…
A: For the solution follow the next steps.
Q: The following six advertising campaigns show the number of ads (x) and the resulting sales revenues…
A: Solution: x y (x-x) (x-x)2 (y-y) (x-x)(y-y) 10 49 0 0 5 0 6 41 -4 16 -3 12 16 49 6 36 5 30…
Q: The following data give the numbers of computer keyboards assembled at the Twentieth Century…
A: Formula for finding percentile rank is,
Q: The table below shows the number of vegetables sold by three vendors in a market for consecutive…
A:
Q: A survey of 500 people were asked this same question and the results were recorded in a tree diagram…
A: As per our guidelines we are supposed to answer only 3 subpart of any questions so i am solving…
Q: The data shown in the following table are highway gasoline mileage performance and engine…
A: Given that, The data on highway gasoline mileage performance and engine displacement for a sample of…
Q: 7. Find the Q.D. and coefficient of Q.D. from the following data. Size Frequency 3.5 4.5 5.5 6.5 5 7…
A: Given that X Frequency 3.5 5 4.5 7 5.5 22 6.5 60 7.5 85 8.5 32 9.5 8
Q: 12. Compute the amount of information and the redundancy of the following data presented in the…
A:
Q: A random sample of 12 professional athletes produced the following data, where x is the number of…
A:
Q: The following is data for the first and second Quiz scores for 8 students in a class. First Quiz…
A: Given data, X Y X*Y X*X 11 10 110 121 15 16 240 225 20 18 360 400 26 19 494 676 29 31…
Q: The following table shows the number of automobile crashes in Durham county by year 2016 2017 2011…
A: y = m*x+b Here ,n=10, ∑x=20125 , ∑y=84982, ∑xy=171055545,∑x2=40501645,∑y2=734303418…
Q: The data to the right represent the number of chocolate chips per cookie in a random sample of a…
A:
Q: The following data represent the chemistry grades for a random sample of 12 freshmen at a certain…
A: Enter the given data into excel as follows:
Q: The following table lists the monthly incomes (in hundreds of dollars) and the monthly rents paid…
A: Solution: Let x = Monthly income and y= Monthly rent x y x2 xy 24 7 576 168 16 4.5 256 72…
Q: A random sample of 11 professional athletes produced the following data, where a is the number of…
A: Solution: n= 11 observation α=0.08 Level of significance Claim : To determine whether or not…
Q: Eight students, randomly selected from a large class, were asked to keep a record of the hours they…
A:
Q: 6) The following data represent the high temperature distribution in degrees Fahrenheit for a sample…
A:
Q: The table shows the number of people who prefer to attend a movie at different times. Afternoon…
A:
Q: The following table shows the marks obtained by 10 students of a college in Accountancy (X) and…
A: Regression equation of Y = Accountancy and X = Statistics: A simple regression equation describes…
Q: The following table contains data from a study of two airlines which fly to Small Town, USA. If one…
A:
Q: The percentages of police officers who are wolell City Population (in thousands) Value Used to…
A: Hello! As you have posted more than 3 sub parts, we are answering the first 3 sub-parts. In case…
Q: A random sample of 5 families had the following income (X) and food expenditure (Y) (in $ per week)…
A: Given, Y X 1 2 4 5 7 8 10 11 14 14
Q: What is the formula for this equation?
A:
Q: 1) Sample from 3 types of wheat were tested for protein percentage. The data is given below Туре I…
A: There are 3 independent samples which are 3 types of wheat. We have to test whether the protein…
Q: The data shown in the following table are highway gasoline mileage performance and engine…
A: Definition: Regression analysis is used measure the association between two are more variables where…
Q: he following table gives the distribution of the total population and Age 0-10 10-20 20–30 30–40…
A: Given data, X Y X*Y X*X Y*Y 100 55 5500 10000 3025 60 40 2400 3600 1600 40 40 1600 1600…
Q: he data shown in the following table are highway gasoline mileage performance and engine…
A: Use EXCEL to obtain the regression equation. EXCEL procedure: Go to EXCEL Go to Data>Data…
Q: The Examination results for selected samples of Quantitative methods students who ok the course from…
A: Hello! As you have posted 2 different questions, we are answering the first question. In case you…
Q: Complete the following table to compare men and women using data collected at the first examination…
A: Given:
Q: The following table gives the age distribution of students admitted to a college in the years 1914…
A:
Q: Eight students, randomly selected from a large class, were asked to keep a record of the hours they…
A:
Q: Let x = (X1, X .. Xy, ....., xm) be a data set with a sample mean Show that E-(x; – x) = 0.
A: Given : Let x = (x1 , x2 , -------, xi,-----,xn) be a data set with a sample mean x¯
Q: Consider a sample of 125 insurance policies from a portfolio of a general insurance company. The…
A: We want to calculate the coefficient of skewness of the data
Q: The following table shows data from a survey of 300 adults. The data show the number of adults that…
A: Solution: The given table of data is
Q: The boxplots below represent movie runtimes (the length of a movie in minutes) for a random sample…
A: The given boxplots represent movie runtimes for a random sample of 100 movies in each of the four…
Q: 3. The following data gives the information on the ages (in years) and the number of breakdowns…
A:
Q: A sales manager collected the following data on annual sales for new customer accounts and the…
A: It was stated that a sales manager collected the data on annual sales for new customer accounts and…
Q: A random sample of 11 professional athletes produced the following data, where r is the number of…
A: We will use R to obtain solution > #enter the data> x=c(5,8,8,7,7,4,5,3,4,8,8)>…
Q: The data in the table represent the number of hours of pain relief provided by 5 different brands of…
A: For the given data find SStot = ? SSbet = ? SSwit = ? MSbet = ? MSwit = ? Fratio = ?
Q: The following six advertising campaigns show the number of ads (x) and the resulting sales revenues…
A: Given :
Q: The data to the right represent the number of chocolate chips per cookie in a random sample of a…
A: Given : The data represents the number of chocolate chips per cookie in a random sample of a name…
Q: The grades of a class of 17 randomly selected students taking a course in Statistics aad a course in…
A: e. Step-by-step procedure to obtain the regression using the Excel: Enter the data for x and y…


Trending now
This is a popular solution!

Step by step
Solved in 2 steps with 1 images


- In Galton’s height data (Figure 7.1, in Section 7.1), the least-squares line for predictingforearm length (y) from height (x) is y = −0.2967 + 0.2738x.a) Predict the forearm length of a man whose height is 70 in.b) How tall must a man be so that we would predict his forearm length to be 19 in.?c) All the men in a certain group have heights greater than the height computed in part(b). Can you conclude that all their forearms will be at least 19 in. long? Explain.In a study of the causes of bearing wear, a machine was run 24 times, with various loads (denoted x1), oil viscosities (x2), and ambient temperatures (x3). The wear, denoted y, was modeled as y = β0 + β1x1 + β2x2 + β3x3 + ε. When this model was fit to the data, the sum of squares for error was SSE = 9.37. Then the reduced model y = β0 + β1x1 + β2x2 + β3x3 was fit, and the sum of squares for error was SSE = 27.49. Is it reasonable to use the reduced model, rather than the model containing all the interactions, to predict wear? Explain.When a least squares line is fit to the 12 observations in the labor cost data, we obtain SSE =656, 214.3589. Calculate s2 and s (isnt n-k-1)?
- Percentages of public school students in fourth and eighth grades who were above the proficiency level were given for 8 western states 4th Grade Proficiency 8th Grade Proficiency Arizona 15 21 California 11 18 Hawaii 16 16 Montana 22 37 New Mexico 13 13 Oregon 21 32 Utah 23 26 Wyoming 19 25 Construct a scatterplot and comment on any interesting characteristics Find the least squares equation. If Nevada had a 4th grade proficiency of 14%, what would you expect the 8th grade proficiency to be?Various doses of a poisonous substance were givento groups of 25 mice and the following results wereobserved: Dose (mg) Number of deathsx y4 16 38 610 812 1414 1616 20 (a) Find the equation of the least squares line fit tothese data.(b) Estimate the number of deaths in a group of 25 micethat receive a 7-milligram dose of this poison.Rework problem 23 in section 6.3 of your textbook (page 276) except use the following data instead of the data in the textbook: Assume that the production of 1 unit of magnesium requires 0.2 units of magnesium and 0.3 units of aluminum, and that the production of 1 unit of aluminum requires 0.2 units of magnesium and 0.8 units of aluminum.Find the production schedule that satisfies an external demand for 30 units of magnesium and 60 units of aluminum. Rework problem 23 in section 6.3 of your textbook (page 276) except use the following data instead of the data in the textbook: Assume that the production of 1 unit of magnesium requires 0.2 units of magnesium and 0.3 units of aluminum, and that the production of 1 unit of aluminum requires 0.2 units of magnesium and 0.8 units of aluminum. Please look at attched image and show steps to solve for solution
- The following are the scores that 12 students obtainedon the midterm and final examinations in a course instatistics:Midterm examination Final examinationx y71 8349 6280 7673 7793 8985 7458 4882 7864 7632 5187 7380 89 (a) Find the equation of the least squares line that willenable us to predict a student’s final examination score inthis course on the basis of his or her score on the midtermexamination.(b) Predict the final examination score of a student whoreceived an 84 on the midterm examination.Is each of these True or False? (i) The least squares regression line is the line that minimizes the sum of the squares of the residuals. (ii) The least squares regression line must go through as many data points as possible. (iii) If a data point falls on the least squares regression line, then its residual is 0. (iv) The least squares regression line is the line that makes the square of the correlation as small as possible.In the manufacture of synthetic fiber, the fiber is often “set” by subjecting it to high temperatures. The object is to improve the shrinkage properties of the fiber. In a test of 23 yarn specimens, the relationship between temperature in °C (x) and shrinkage in % (y) was summarized by the least-squares line y = −12.789 + 0.133x. The total sum of square was ∑ni=1(yi−y⎯⎯)2∑i=1n(yi−y¯)2 = 57.313, and the estimated error variance was s2 = 0.0670. Compute the coefficient of determination r 2. Round the answer to three decimal places.
- In a study of copper bars, the relationship between shear stress in ksi (x) and shear strain in % (y) was summarized by the least-squares line y = −20.00 + 2.56x. There were a total of n = 18 observations, and the coefficient of determination was r 2 = 0.9111. If the total sum of squares was ∑ni=1(yi−y⎯⎯)2∑i=1n(yi−y¯)2 = 234.19, compute the estimated error variance s2. Round the answer to three decimal places.Problem 2:Examine the relationship between amount of time spent studying for an exam (X) in hours andthe score that person makes on an exam (Y)X Y2 653 703 754 705 856 857 90 using spss Give the following:1. Null hypothesis2. Alternative hypothesis3. Statistical test4. Computation5. Decision6. ConclusionProblem 3. Suppose a test for detecting a certain rare disease has been perfected that is capable of discovering the disease in 97% of all afflicted individuals. Suppose further that when it is tried on healthy individuals, 5% of them are incorrectly diagnosed as having the disease. Finally, suppose that when it is tried on individuals who have certain other milder diseases, 10% of them are incorrectly diagnosed. It is known that the percentages of individuals of the three types being considered here in the populations at large are 1%, 96%, and 3%, respectively. Calculate the probability that an individual, selected at random from the population at large and tested for the rare disease, actually has the disease if the test indicates he is so afflicted.