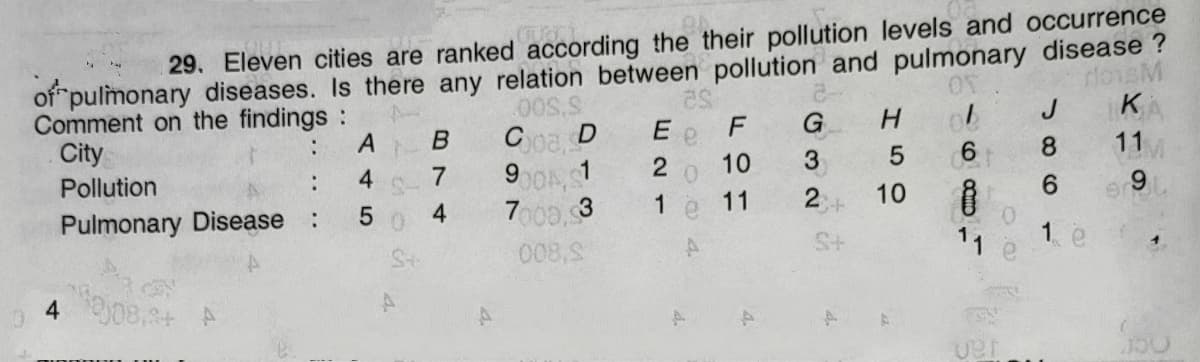
29. Eleven cities are ranked according the their pollution levels and occurrence of pulmonary diseases. Is there any relation between pollution and pulmonary disease ? lonsM Comment on the findings : City .00S.S C G J K Pollution 4 7. 9 01 10 3 8 11 : 6. 0. 1. Pulmonary Disease 4 3 1 11 10 9. : 008,S 4. 11 D.


Q: 1. Given below are information from a sample of single-pet owners (out of a total of 120 single-pet…
A: Given:
Q: 4. The average normal daily temperature (in degree Celsius) and the corresponding average monthly…
A: given the average normal daily temperature and the corresponding average monthly precipitation for…
Q: 3.6 The article "The Need to Be Plugged In" (Associated Press, December 22, 2005) described the…
A: Introduction: The comparative bar chart would show side-by-side bars representing the relative…
Q: (a) In scatterplot 1, does there appear to be a relationship between x and y? There appears to be a…
A: It is an important part of statistics. It is widely used.
Q: 1. Given below are information from a sample of single-pet owners (out of a total of 120 single-pet…
A: The total pet owners in the population is 120 and the sample of size 25 is selected from that…
Q: 3. The reaction times of an individual in certain stimuli were measured by a psychologist to be…
A: The data shows the reaction times of an individual in certain stimuli.
Q: " (a) The following table gives the number of defects in carpets manufactured: Carpet Serial No. : 1…
A:
Q: 11.27 A firm that prints automobile bumper stickers conducts a study to investigate the relation…
A: In this question, a data has been given on the basis of which we have to find the the regression…
Q: 1.The manager of an auto dealership would like to develop a model the fuel consumption of various…
A: Given data represents fuel consumption of various car models based on engine size. Here, The…
Q: 8 The following are the number of minutes it takes 10 typists to finish a piece of secretarial work…
A: Scatter plot: A Scatter plot is a non-mathematical representation of data, that shows the degree of…
Q: You work for an insurance company and are studying the relationship between types of crashes and the…
A: A chi-square test of independence is used to test the relation between two categorical variables.…
Q: 1.- The following data are the top 40 men's finish times (rounded to nearest minute) in the 2022 LA…
A: The given data is related to top 40 men's finish times in the 2022 LA marathon Total no.of men's…
Q: 4. A used car dealer wants to determine the relationship between the milag thousand miles) and the…
A: “Since you have posted a question with multiple sub-parts, we will solve first three sub-parts for…
Q: It is claimed that a new diet will reduce a person's weight by 4.5 kg, on average, in a period of 2…
A: Given information: Group 1 Group 2 Group 3 Before After Before After Before After 64 59…
Q: If frequency of an item a is given as 4, and total number of items in the collected data is 44; then…
A:
Q: 11.18 A company that manages four hotels wants to compare the quality of service provided in them.…
A: The ANOVA is used to compare the more than two population group means. While, the ANOVA is works…
Q: The authors of a paper compared two different methods for measuring body fat percentage. One method…
A: Given: n = 16 Confidence level = 95% α = 0.05 Formula Used: Confidence interval = d ± tsdn
Q: 38 A firm not sure of the response to its product in ten different colour shades decides to produce…
A: Given data :
Q: What is the relationship between Za and Zb? a
A: There are three-lines intersecting each other at a point. Two angles a and b are shown in the…
Q: 11.27 B A firm that prints automobile bumper stickers conducts a study to investigate the relation…
A: Solution:c.Residual standard deviation:The residual standard deviation is the standard deviation of…
Q: If mu and sigma are the process mean and sd then the control limits mu+or- 3sigma are know as
A:
Q: The following table shows the marks obtained by 10 students of a college in Accountancy (X) and…
A: Regression equation of Y = Accountancy and X = Statistics: A simple regression equation describes…
Q: If frequency of an item z is given as 9, and total number of items in the collected data is 43; then…
A: The relative frequency is given by, Relative Frequency=fn Where, f is the frequency the data…
Q: A researcher wishes to determine if there is a relationship between residence and approval of some…
A: The following information has been provided: Favor Oppose Urban 164 134 Suburban…
Q: 9. An analysis of 8 used trucks listed for sale in the 48076 zip code finds that the power model…
A: Given:
Q: The temperature of two cities Aand B in a winter season are given below: City A 11 14 15…
A: Given: Sr. No. City A (x1) City B (x2) 1 11 18 2 14 20 3 15 22 4 17 24 5 18 26
Q: wenty-one mature flowers of a particular species were dissected, and the number of stamens and…
A: (a) Is there sufficient evidence to claim a linear relationship between these two variables at α =…
Q: If frequency of an item z is given as 2, and total number of items in the collected data is 40; then…
A: Given the frequency of an item x is 2 and total number of items in the collected data is 40. We have…
Q: Complete the following table to compare men and women using data collected at the first examination…
A: Given:
Q: 3. The following data are based on information from the book Life in America's Small Cities (by G.S.…
A:
Q: Twenty-one mature flowers of a particular species were dissected, and the number of stamens and…
A:
Q: Twenty-one mature flowers of a particular species were dissected, and the number of stamens and…
A: Since you have posted a question with multiple sub-parts, we will solve first three sub- parts for…
Q: 8. Find out whether or not there is a dependency relation between sales and store location for the…
A: Null hypothesis, H0:there is no significant relation between sales and store location Alternative…
Q: 7. If the minimum value of data equal 10 and maximum value of data equal 50 and the number of class…
A:
Q: 1. The manager of an auto dealership would like to develop a model the fuel consumption of various…
A: Given information: The data is provided consisting of various car models, their engine size, and…
Q: 2. Consider the foot length and foot width of six fermale grade 4 students in Morning Star…
A: Standard deviation is given by, Sx = √E(X2)-(E(X))2 E(X)= ∑xi/n E(X2)= ∑xi2/n
Q: 6. The personnel department of a company has records which show the following analysis of its ..…
A: Given: The table given is as follows Uni Bachelors Masters Phd UODA xxxx xxx xxx North South…
Q: Using Excel construct a scatter plot. Discuss the output of the scatter plot. Give (or calculate)…
A: Let X be the variable defined as price of the item and Y be the variable defined as time taken for…
Q: An Internet Service Provider (ISP) offers three plans, High Speed (H), Medium Speed (M) and Low…
A: ISP changing plan using transition matrix A, using the given data set we make transition matrix A…
Q: The distribution of number of stores according to size in 3 areas is given in the following table:…
A: Since you have posted a question with multiple sub-parts, we will solve first three subparts for…
Q: 31. Calculate Coefficient of Concurrent Deviation from the following data: X: 1 2. 3 4. 5. Y: 25 16…
A:
Q: For eight pairs of observations on two variables sales (X) and Pricing (Y), the following results…
A:
Q: 2. Below are the distances travelled (km) by a sample of workers of a call center on their way to…
A: Given the data 5.0 30.3 14.7 19.2 6.2 9.0 19.6 22.9 41.6 11.4 17.3 31.1 9.6 12.8 12.2…
Q: 1) The following table gives the age-adjusted cancer incidence rates (new cases) per 100,000 people…
A: As per guidelines, we will only answer first question, for more solutions please repost the other…
Q: 1. Given below are information from a sample of single-pet owners (out of a total of 120 single-pet…
A: Given: Age of pet owners 16 16 24 16 17 30 55 18 25 17 20 21
Q: 1. Given below are information from a sample of single-pet owners (out of a total of 120 single-pet…
A: The following data is given: Pet owner Sex of pet owner Age of pet owner (in years) Pet Owned 1…
Q: 1. A computer manager interested to know how efficiency of his/her new computer program which…
A: Given: n = 7 Formula Used: Correlation coefficient r = n∑XY-∑X∑Yn∑X2-∑X2n∑Y2-∑Y2 Regression…
Q: Here are data on the years of schooling completed, x, and annual income, y, (in thousands of…
A:
Q: Activity 19 number 4 &5
A: 4. In the following table, we have stored the data on the number of orange candies, and total number…

Step by step
Solved in 2 steps with 2 images

- A doctor is concerned about the relationship between blood pressure and irregular heartbeats.Among her patients, she classifies blood pressures as high, normal, or low and heartbeats asregular or irregular and finds that:• 16% have high blood pressure;• 19% have low blood pressure; • 17% have an irregular heartbeat;• of those with an irregular heartbeat, 35% have high blood pressure; and• of those with normal blood pressure, 11% have an irregular heartbeat.What percentage of her patients have a regular heartbeat and low blood pressure?4. A pharmaceutical company wants to test whether the incidence of side effects (i.e. adverse events)differs between the treatment and placebo groups at theα= 0.05. Letp1= the proportion of subjects in the treatment groups who experienced at least one adverse event and letp2= the proportion of subjects in the placebo group who experience at least one adverse event. 8 out of 30 people in the treatment group experienced at least one adverse event and 5 out of 30 people in the placebo group experienced at least one adverse event. (a) Set up the null and alternative hypothesis (using mathematical notation/numbers AND interpret them in the context of the problem) (b) Calculate the test statistic (c) Calculate the critical value (d) Draw a picture of the distribution of the test statistic under H0. Label and provide values for the critical value and the test statistic, and shade the critical region. (e) Make and justify a statistical decision at theα= 0.05 level and state your conclusions in…Develop two research hypotheses: (a) one that would be used to examine differences between two unrelated groups and (b) one that would examine differences between two dependent groups.
- 5. Suppose a quarterback’s completion percentage for the season is 67.2%. Based on relative frequency, is it more likely that he will complete his next two passes or that at least one ofthem will be incomplete?One strategy that may have an impact on employee retention, turnover and engagement is a successful employee recognition program. Surveying small organizations, those with 500 to 2,499 employees, and large organizations, those with 10,000 or more employees, a survey organization showed that346(79%)of the 440 small organizations have employee retention programs as compared to 173 (88%) of the 196 large organizations. a. At the 0.01 level of significance, is there evidence of a significant difference between organizations with 500 to 2,499 employees and organizations with 10,000 or more employees with respect to the proportion that have employee recognition programs? a.Determine the null and alternative hypotheses, where π1 is the population proportion of organizations with 500 to 2,499 employees with employee recognition programs and π2 is the population proportion of organizations with 10,000 or more employees with employee recognition programs. b. Determine the…Lin Chi-Ling works for an insurance company and is studying the relationship between types of crashes and the vehicles involved in passenger vehicle occupant deaths. As part of your study, you randomly select 4270 vehicle crashes and organize the resulting data as shown in the contingency table. At α = 0.05 can you conclude that the type of crash depends on the type of vehicle? Vehicle Type of crash Car Pickup Sport utility Single-vehicle 1237 547 479 Multiple-vehicle 1453 307 247 What is the Chi-square test statistics and the decision for this question. The Test statistics is . Leave answers in 3 decimal places. DECISION: We the null hypothesis.
- Suppose that 80% of 3–4-year-old children and 70% of5–8-year-old children in a village are vaccinated with QIVvaccine. Also assume that children who are not vaccinatedhave twice the incidence of influenza as the control groupin Table 3.7.3.29 What % of 3–4-year-old children in the village will getinfluenza?3.30 What % of 5–8-year-old children in the village will getinfluenza?3.31 Suppose we identify a 5–8-year-old child with influenzain the village but are uncertain whether the childwas vaccinated. If we make the same assumptions as inProblems 3.29–3.30, then what is the probability that thechild was vaccinated? (Hint: Use Bayes’ rule here.)A sociologist wants to investigate the question, "Is there a relationship between texting during class and grade-point-average (GPA) among high school seniors in a large district?" Which study design is most appropriate? Before the semester starts, randomly select 40 seniors from each high school who do not text during class. Assign 20 to the texting treatment group (text three or more times during every class meeting) and 20 to the control group (no texting during class). At the end of the semester, obtain each student’s GPA from the appropriate admissions and records office. Compare the GPA of students who routinely text during class to the GPA of students who do not text during class. Before the semester starts, randomly select 40 seniors from each high school who do not text during class. Assign 20 to the texting treatment group (text three or more times during every class meeting) and 20 to the control group (no texting during class). At the end of the semester,…In a certain school district, it was observed that 25% of the students in the element schools were classified as only children (no siblings). However, in the special program for talented and gifted children, 93 out of 316 students are only children. The school district administrators want to know if the proportion of only children in the special program is significantly different from the proportion for the school district. Test at the α=0.01α=0.01 level of significance.
- Ashik is planning to propose to a girl he has a crush on in a grand way. He has decided to create an animation movie, conveying his love to his crush and he needs to estimate the total production time (labor-hours necessary) to produce the movie. Since he is so rich, he wants to use multiple big screens to project the movie and the mean production time for a random sample of 14 big-screen animated movie is found to be 53,500 labor-hours. Suppose that Ashik has managed to find out that the population standard deviation is 7462 labor-hours and the distribution of the production time is normal. 10 Construct a 98% confidence interval for the mean production time to produce a big-screen animated movieA group of students in Methods of Social Research wanted to study the relationship between GPA and participation in athletics among ENC traditional undergraduates. Other researchers have found that students involved in Division III athletics often have higher GPAs than the rest of the student body, so the group of students in Methods wanted to know whether this was true for ENC students. They were able to gather data on 160 ENC students (80 athletes and 80 non-athletes) and found that, among this group, the 80 athletes had slightly higher GPAs on average than the 80 students who were not athletes. In this study, who makes up the sample? Who makes up the population? Suppose they found in the sample data that the overall GPA for ENC athletes was 3.35 and for the ENC non-athletes was 3.21. Are these statistics or parameters?A school district started using a new criteria for selecting which students entered their "accelerated" math track, starting in 6th grade. The study found that under the new criteria about 75% of the students in the district were eligible for accelerated math in 6th grade, but that from one year to the next only about 2/3 of the students stayed in the accelerated track. a) Assuming that everyone who is eligible enrolls the first year, make a TABLE that shows the percent of the students in the district that would be expected to be enrolled in the accelerated track each year from 6th grade until 10th grade. Please show the work you used to fill in your table. b) Considering that from one year to the next about 2/3 of the students stay in the accelerated track, is there a grade level in which you'd expect about 1/10 as many students in the accelerated track as there were in 6th grade? Does the number of students in the accelerated track in 6th grade affect your answer? Please show your…