1. The chart of data represents the heart rate (beats per mimute) of a jogger over time (minutes). Time (Min) 1 3 4. 6. ВРМ 81 84 86 91 97 102 108 112 la. Write the equation of the Line of Best Fit
1. The chart of data represents the heart rate (beats per mimute) of a jogger over time (minutes). Time (Min) 1 3 4. 6. ВРМ 81 84 86 91 97 102 108 112 la. Write the equation of the Line of Best Fit

Glencoe Algebra 1, Student Edition, 9780079039897, 0079039898, 2018
18th Edition
ISBN:9780079039897
Author:Carter
Publisher:Carter
Chapter4: Equations Of Linear Functions
Section4.5: Correlation And Causation
Problem 24PFA

Related questions
Question
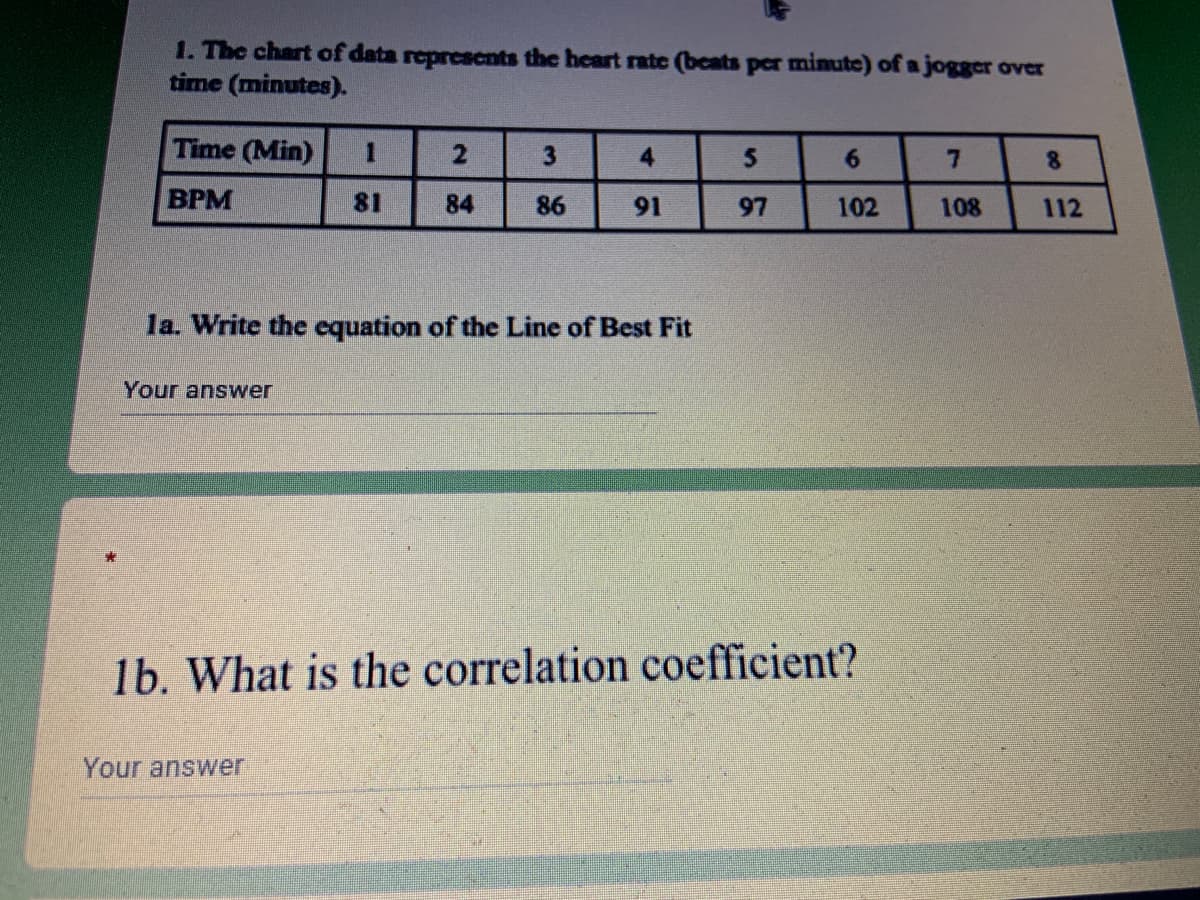
Transcribed Image Text:1. The chart of data represents the heart rate (beats per mimute) of a jogger over
time (minutes).
Time (Min)
1
3
4
6.
7.
8.
BPM
81
84
86
91
97
102
108
112
la. Write the cquation of the Line of Best Fit
Your answer
1b. What is the correlation coefficient?
Your answer
Expert Solution
This question has been solved!
Explore an expertly crafted, step-by-step solution for a thorough understanding of key concepts.

Step by step
Solved in 3 steps with 2 images

Recommended textbooks for you
Glencoe Algebra 1, Student Edition, 9780079039897…
Algebra
ISBN:
9780079039897
Author:
Carter
Publisher:
McGraw Hill

Big Ideas Math A Bridge To Success Algebra 1: Stu…
Algebra
ISBN:
9781680331141
Author:
HOUGHTON MIFFLIN HARCOURT
Publisher:
Houghton Mifflin Harcourt
Glencoe Algebra 1, Student Edition, 9780079039897…
Algebra
ISBN:
9780079039897
Author:
Carter
Publisher:
McGraw Hill
Big Ideas Math A Bridge To Success Algebra 1: Stu…
Algebra
ISBN:
9781680331141
Author:
HOUGHTON MIFFLIN HARCOURT
Publisher:
Houghton Mifflin Harcourt