Suppose an oceanographer monitors the daily salinity of a particular ocean in relation to the temperature of the water. The oceanographer plots the data with temperature, in degrees Celsius (°C), along the horizontal axis and salinity, in parts per thousand (ppt), along the vertical axis. 40- .. 30- 20- 10 12 15 18 21 24 Oceanic temperature ("C) Select the true statement about the data point identified by the arrow. When salinity reaches 36 ppt, this causes the ocean temperature to be approximately 12 °C. There is no relationship between the temperature of the ocean on a given day and salinity. The observed salinity is 36 ppt when the ocean temperature for the day is 12 °C. An ocean temperature of 36 °C corresponds to a salinity level of 12 ppt. Salinity (ppt)
Suppose an oceanographer monitors the daily salinity of a particular ocean in relation to the temperature of the water. The oceanographer plots the data with temperature, in degrees Celsius (°C), along the horizontal axis and salinity, in parts per thousand (ppt), along the vertical axis. 40- .. 30- 20- 10 12 15 18 21 24 Oceanic temperature ("C) Select the true statement about the data point identified by the arrow. When salinity reaches 36 ppt, this causes the ocean temperature to be approximately 12 °C. There is no relationship between the temperature of the ocean on a given day and salinity. The observed salinity is 36 ppt when the ocean temperature for the day is 12 °C. An ocean temperature of 36 °C corresponds to a salinity level of 12 ppt. Salinity (ppt)

Big Ideas Math A Bridge To Success Algebra 1: Student Edition 2015
1st Edition
ISBN:9781680331141
Author:HOUGHTON MIFFLIN HARCOURT
Publisher:HOUGHTON MIFFLIN HARCOURT
Chapter11: Data Analysis And Displays
Section: Chapter Questions
Problem 4CT

Related questions
Question
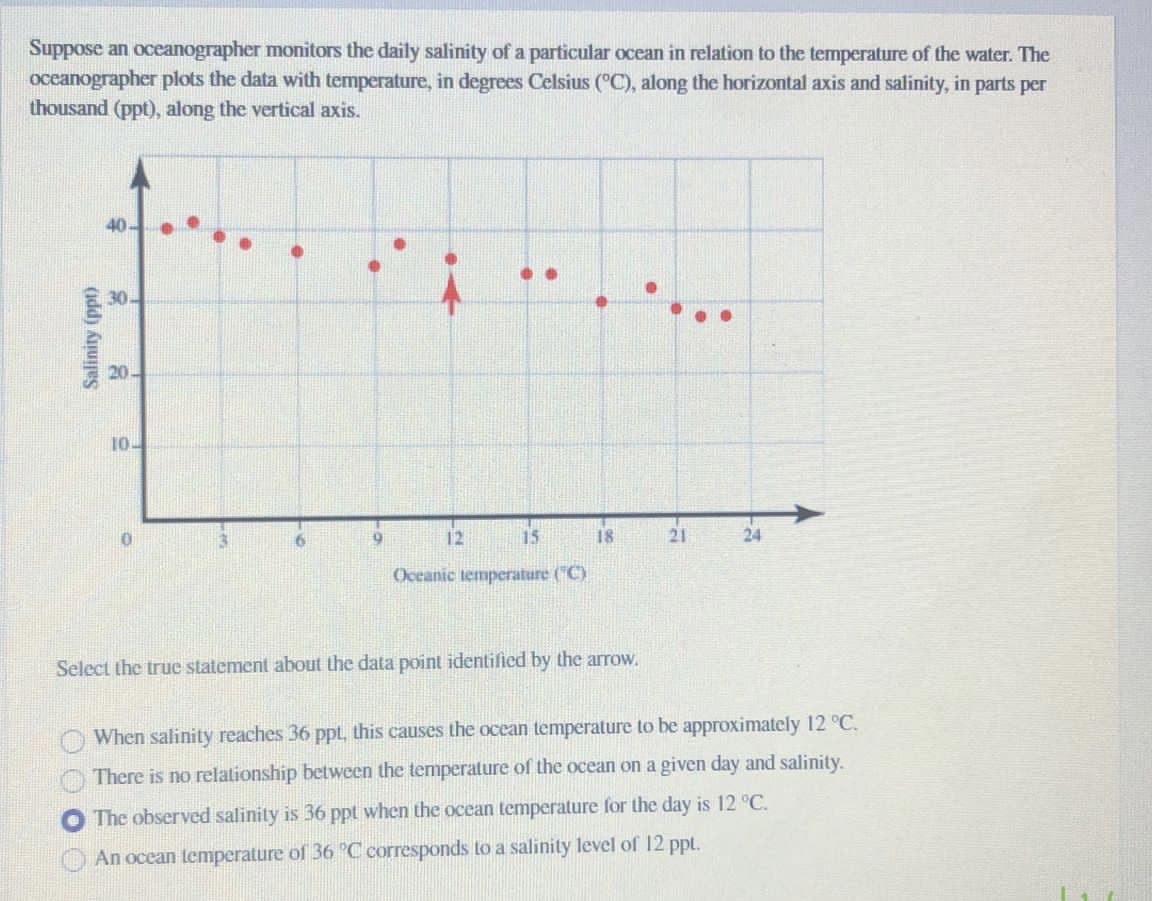
Transcribed Image Text:Suppose an oceanographer monitors the daily salinity of a particular ocean in relation to the temperature of the water. The
occanographer plots the data with temperature, in degrees Celsius (°C), along the horizontal axis and salinity, in parts per
thousand (ppt), along the vertical axis.
40-
30-
20-
10
12
15
18
21
24
Oceanic temperature ("C)
Select the true statement about the data point identified by the arrow.
When salinity reaches 36 ppt, this causes the ocean temperature to be approximately 12 °C.
There is no relationship between the temperature of the ocean on a given day and salinity.
The observed salinity is 36 ppt when the ocean temperature for the day is 12 °C.
An ocean temperature of 36 C corresponds to a salinity level of 12 ppt.
Salinity (ppt)
Expert Solution
This question has been solved!
Explore an expertly crafted, step-by-step solution for a thorough understanding of key concepts.

This is a popular solution!

Trending now
This is a popular solution!

Step by step
Solved in 2 steps

Recommended textbooks for you
Big Ideas Math A Bridge To Success Algebra 1: Stu…
Algebra
ISBN:
9781680331141
Author:
HOUGHTON MIFFLIN HARCOURT
Publisher:
Houghton Mifflin Harcourt

Algebra & Trigonometry with Analytic Geometry
Algebra
ISBN:
9781133382119
Author:
Swokowski
Publisher:
Cengage

Glencoe Algebra 1, Student Edition, 9780079039897…
Algebra
ISBN:
9780079039897
Author:
Carter
Publisher:
McGraw Hill
Big Ideas Math A Bridge To Success Algebra 1: Stu…
Algebra
ISBN:
9781680331141
Author:
HOUGHTON MIFFLIN HARCOURT
Publisher:
Houghton Mifflin Harcourt
Algebra & Trigonometry with Analytic Geometry
Algebra
ISBN:
9781133382119
Author:
Swokowski
Publisher:
Cengage
Glencoe Algebra 1, Student Edition, 9780079039897…
Algebra
ISBN:
9780079039897
Author:
Carter
Publisher:
McGraw Hill

Holt Mcdougal Larson Pre-algebra: Student Edition…
Algebra
ISBN:
9780547587776
Author:
HOLT MCDOUGAL
Publisher:
HOLT MCDOUGAL