1. The following data has been collected to determine if a relationship exists between the amount of snowfall in Toronto and the number of students who attend lecture at U of T. Year Snowfall, x (cm) Number of students in class, y 1995 173 182 1996 165 190 1997 152 207 1998 184 180 1999 178 184 a. Determine the line of best fit by creating a scatter plot in Excel, a trendline, and the correlation coefficient. Make sure your scatter plot is properly titled and formatted. b. Explain what this correlation tells you about the relationship between the amount of snowfall and the number of students who attend lecture. c. How many students could we expect to attend a lecture if it were to snow 160 cm in a season. Is this an example of interpolation or extrapolation?


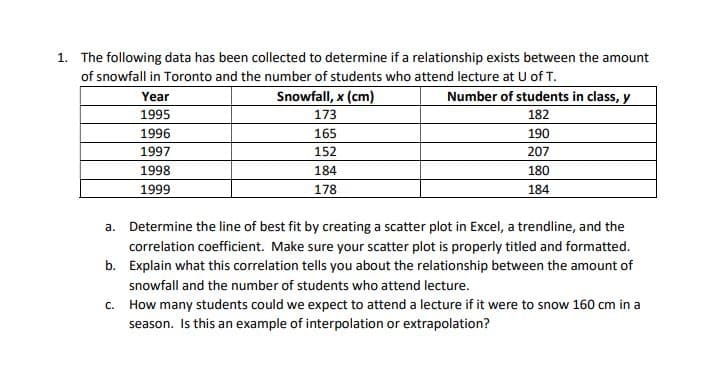
1. The following data has been collected to determine if a relationship exists between the amount
of snowfall in Toronto and the number of students who attend lecture at U of T.
Year Snowfall, x (cm) Number of students in class, y
1995 173 182
1996 165 190
1997 152 207
1998 184 180
1999 178 184
a. Determine the line of best fit by creating a
b. Explain what this correlation tells you about the relationship between the amount of
snowfall and the number of students who attend lecture.
c. How many students could we expect to attend a lecture if it were to snow 160 cm in a
season. Is this an example of interpolation or extrapolation?

Step by step
Solved in 4 steps with 2 images


