1. The following data is given: 2 5 8 9 13 15 y 7 8 10 11 12 14 15 Use linear least-squares regression to determine the coefficients m and b in the function y Make a plot that shows the function and the data points. mx +b that best fits the data. %3D
1. The following data is given: 2 5 8 9 13 15 y 7 8 10 11 12 14 15 Use linear least-squares regression to determine the coefficients m and b in the function y Make a plot that shows the function and the data points. mx +b that best fits the data. %3D

College Algebra
7th Edition
ISBN:9781305115545
Author:James Stewart, Lothar Redlin, Saleem Watson
Publisher:James Stewart, Lothar Redlin, Saleem Watson
Chapter1: Equations And Graphs
Section: Chapter Questions
Problem 5P

Related questions
Question
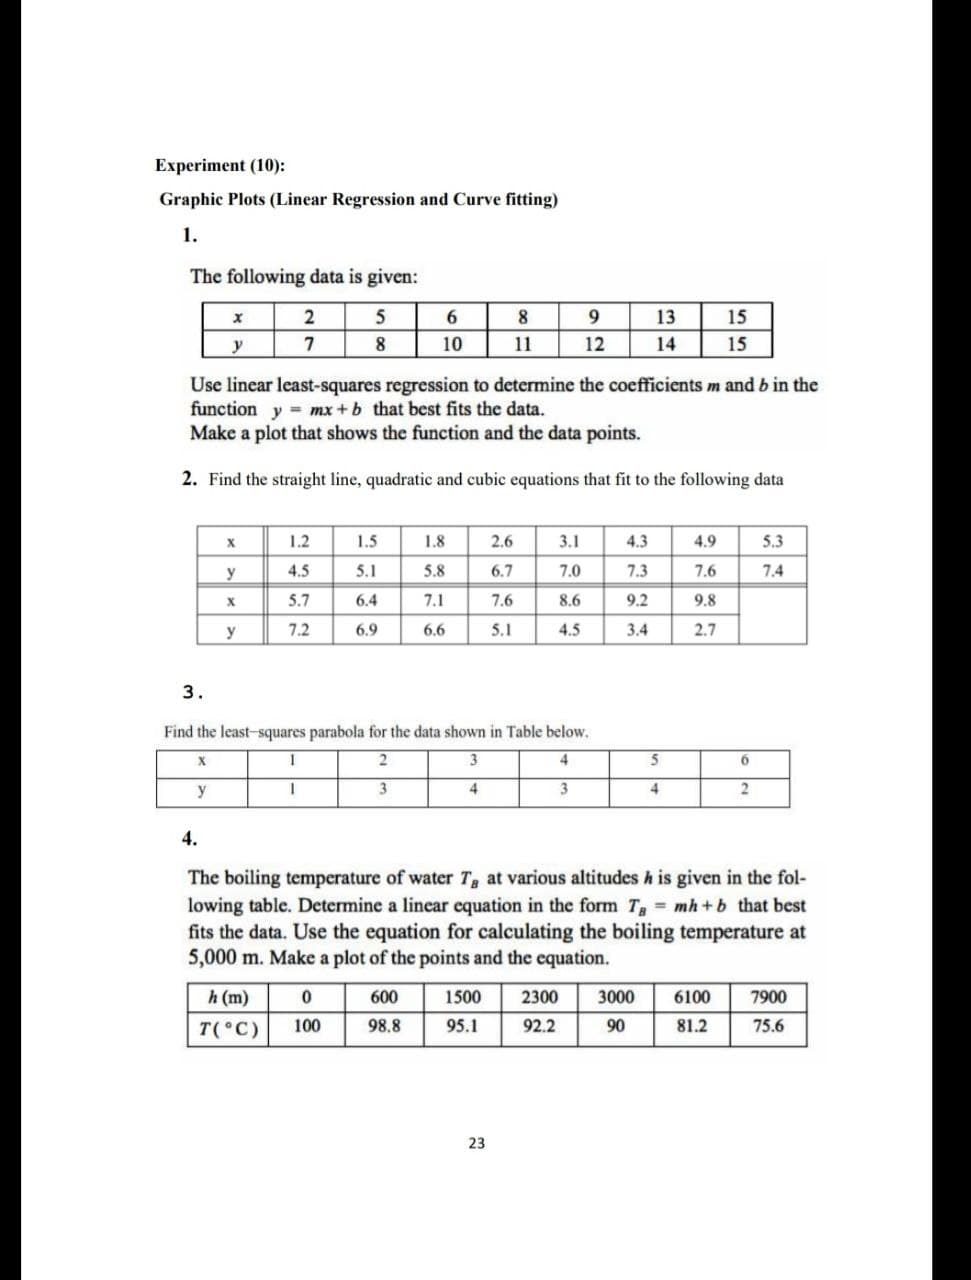
Transcribed Image Text:Experiment (10):
Graphic Plots (Linear Regression and Curve fitting)
1.
The following data is given:
2
5
8
13
15
y
7
8
10
11
12
14
15
Use linear least-squares regression to determine the coefficients m and b in the
function y = mx +b that best fits the data.
Make a plot that shows the function and the data points.
%3D
2. Find the straight line, quadratic and cubic equations that fit to the following data
1.2
1.5
1.8
2.6
3.1
4.3
4.9
5.3
y
4.5
5.1
5.8
6.7
7.0
7.3
7.6
7.4
5.7
6.4
7.1
7.6
8.6
9.2
9.8
y
7.2
6.9
6.6
5.1
4.5
3.4
2.7
3.
Find the least-squares parabola for the data shown in Table below.
2
3
4
5
y
3
4
3
4
4.
The boiling temperature of water T, at various altitudes h is given in the fol-
lowing table. Determine a linear equation in the form T = mh +b that best
fits the data. Use the equation for calculating the boiling temperature at
5,000 m. Make a plot of the points and the equation.
h (m)
600
1500
2300
3000
6100
7900
T( C)
100
98.8
95.1
92.2
90
81.2
75.6
23
Expert Solution
This question has been solved!
Explore an expertly crafted, step-by-step solution for a thorough understanding of key concepts.

Step by step
Solved in 2 steps with 3 images

Recommended textbooks for you
College Algebra
Algebra
ISBN:
9781305115545
Author:
James Stewart, Lothar Redlin, Saleem Watson
Publisher:
Cengage Learning


Elementary Linear Algebra (MindTap Course List)
Algebra
ISBN:
9781305658004
Author:
Ron Larson
Publisher:
Cengage Learning
College Algebra
Algebra
ISBN:
9781305115545
Author:
James Stewart, Lothar Redlin, Saleem Watson
Publisher:
Cengage Learning
Elementary Linear Algebra (MindTap Course List)
Algebra
ISBN:
9781305658004
Author:
Ron Larson
Publisher:
Cengage Learning

Algebra & Trigonometry with Analytic Geometry
Algebra
ISBN:
9781133382119
Author:
Swokowski
Publisher:
Cengage

Algebra and Trigonometry (MindTap Course List)
Algebra
ISBN:
9781305071742
Author:
James Stewart, Lothar Redlin, Saleem Watson
Publisher:
Cengage Learning