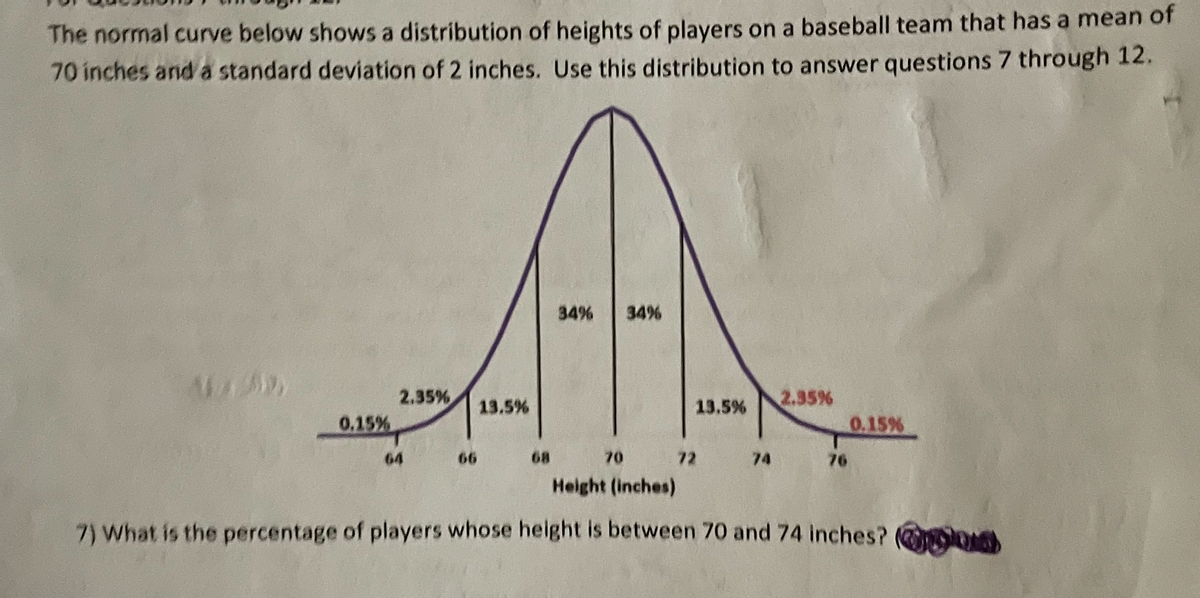
The normal curve below shows a distribution of heights of players on a baseball team that has a mean of 70 inches and a standard deviation of 2 inches. Use this distribution to answer questions 7 through 12. 34% 34% 2.35% 13.5% 13.5% 2.35% 0.15% 0.15% 64 66 68 70 72 74 76 Height (inches) 7) What is the percentage of players whose height is between 70 and 74 inches? lO
The normal curve below shows a distribution of heights of players on a baseball team that has a mean of 70 inches and a standard deviation of 2 inches. Use this distribution to answer questions 7 through 12. 34% 34% 2.35% 13.5% 13.5% 2.35% 0.15% 0.15% 64 66 68 70 72 74 76 Height (inches) 7) What is the percentage of players whose height is between 70 and 74 inches? lO

Glencoe Algebra 1, Student Edition, 9780079039897, 0079039898, 2018
18th Edition
ISBN:9780079039897
Author:Carter
Publisher:Carter
Chapter10: Statistics
Section10.4: Distributions Of Data
Problem 19PFA

Related questions
Question
Transcribed Image Text:The normal curve below shows a distribution of heights of players on a baseball team that has a mean of
70 inches and a standard deviation of 2 inches. Use this distribution to answer questions 7 through 12.
34%
34%
2.35%
13.5%
13.5%
2.35%
0.15%
0.15%
64
66
68
70
72
74
76
Height (inches)
7) What is the percentage of players whose height is between 70 and 74 inches? lO
Expert Solution
This question has been solved!
Explore an expertly crafted, step-by-step solution for a thorough understanding of key concepts.

This is a popular solution!

Trending now
This is a popular solution!

Step by step
Solved in 2 steps with 2 images

Recommended textbooks for you
Glencoe Algebra 1, Student Edition, 9780079039897…
Algebra
ISBN:
9780079039897
Author:
Carter
Publisher:
McGraw Hill
Glencoe Algebra 1, Student Edition, 9780079039897…
Algebra
ISBN:
9780079039897
Author:
Carter
Publisher:
McGraw Hill