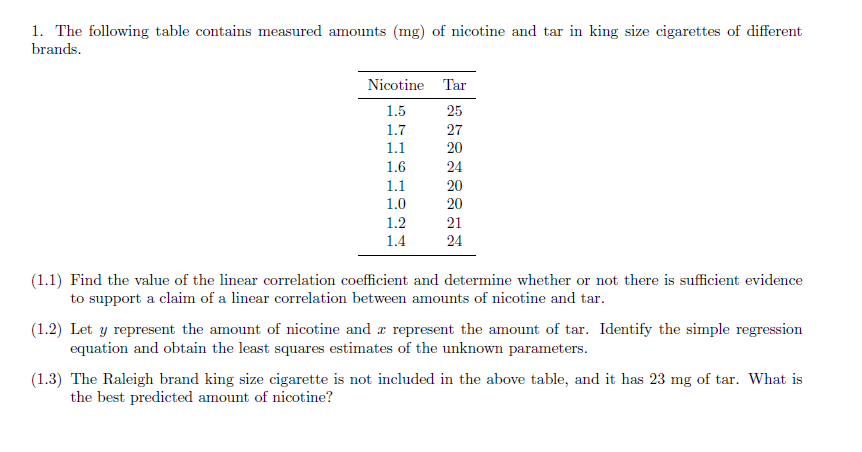
1. The following table contains measured amounts (mg) of nicotine and tar in king size cigarettes of different brands. Nicotine Tar 1.5 25 1.7 27 1.1 20 1.6 24 1.1 20 1.0 20 1.2 21 1.4 24 (1.1) Find the value of the linear correlation coefficient and determine whether or not there is sufficient evidence to support a claim of a linear correlation between amounts of nicotine and tar. (1.2) Let y represent the amount of nicotine and a represent the amount of tar. Identify the simple regression equation and obtain the least squares estimates of the unknown parameters. (1.3) The Raleigh brand king size cigarette is not included in the above table, and it has 23 mg of tar. What is the best predicted amount of nicotine?
1. The following table contains measured amounts (mg) of nicotine and tar in king size cigarettes of different brands. Nicotine Tar 1.5 25 1.7 27 1.1 20 1.6 24 1.1 20 1.0 20 1.2 21 1.4 24 (1.1) Find the value of the linear correlation coefficient and determine whether or not there is sufficient evidence to support a claim of a linear correlation between amounts of nicotine and tar. (1.2) Let y represent the amount of nicotine and a represent the amount of tar. Identify the simple regression equation and obtain the least squares estimates of the unknown parameters. (1.3) The Raleigh brand king size cigarette is not included in the above table, and it has 23 mg of tar. What is the best predicted amount of nicotine?

Glencoe Algebra 1, Student Edition, 9780079039897, 0079039898, 2018
18th Edition
ISBN:9780079039897
Author:Carter
Publisher:Carter
Chapter4: Equations Of Linear Functions
Section4.5: Correlation And Causation
Problem 24PFA

Related questions
Question
Transcribed Image Text:1. The following table contains measured amounts (mg) of nicotine and tar in king size cigarettes of different
brands.
Nicotine Tar
1.5
25
1.7
27
1.1
20
1.6
24
1.1
20
1.0
20
1.2
21
1.4
24
(1.1) Find the value of the linear correlation coefficient and determine whether or not there is sufficient evidence
to support a claim of a linear correlation between amounts of nicotine and tar.
(1.2) Let y represent the amount of nicotine and a represent the amount of tar. Identify the simple regression
equation and obtain the least squares estimates of the unknown parameters.
(1.3) The Raleigh brand king size cigarette is not included in the above table, and it has 23 mg of tar. What is
the best predicted amount of nicotine?
Expert Solution
This question has been solved!
Explore an expertly crafted, step-by-step solution for a thorough understanding of key concepts.

Step by step
Solved in 2 steps with 2 images

Recommended textbooks for you
Glencoe Algebra 1, Student Edition, 9780079039897…
Algebra
ISBN:
9780079039897
Author:
Carter
Publisher:
McGraw Hill
Glencoe Algebra 1, Student Edition, 9780079039897…
Algebra
ISBN:
9780079039897
Author:
Carter
Publisher:
McGraw Hill