Practice/Exercises: Find the area under the normal curve in each of the following cases: 1. Between z = 0 and z = 1.63 2. Between z = 1.56 and z = 2.51 3. Between z = -2.46 and z = 1.55 4. To the right of z = 2.35||| 5. To the left of z=0.35
Practice/Exercises: Find the area under the normal curve in each of the following cases: 1. Between z = 0 and z = 1.63 2. Between z = 1.56 and z = 2.51 3. Between z = -2.46 and z = 1.55 4. To the right of z = 2.35||| 5. To the left of z=0.35

Algebra & Trigonometry with Analytic Geometry
13th Edition
ISBN:9781133382119
Author:Swokowski
Publisher:Swokowski
Chapter7: Analytic Trigonometry
Section7.6: The Inverse Trigonometric Functions
Problem 91E

Related questions
Question
NOTE: PLEASE SKETCH
Transcribed Image Text:11:32
STAT-Q3-Wk-4-LAS-10-12-TNHS
Done
Q
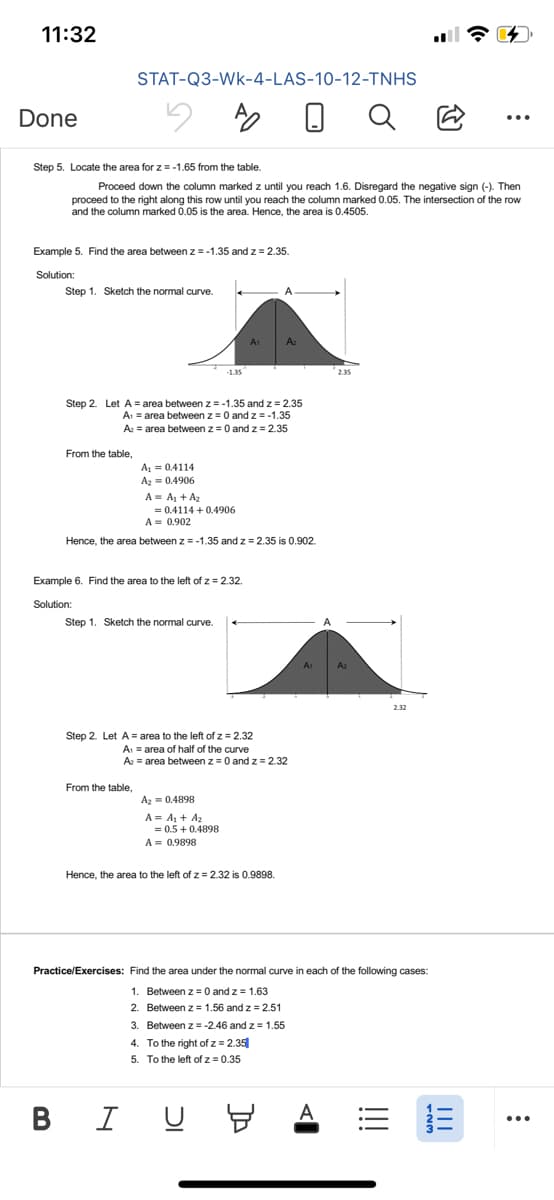
Step 5. Locate the area for z = -1.65 from the table.
Proceed down the column marked z until you reach 1.6. Disregard the negative sign (-). Then
proceed to the right along this row until you reach the column marked 0.05. The intersection of the row
and the column marked 0.05 is the area. Hence, the area is 0.4505.
Example 5. Find the area between z = -1.35 and z = 2.35.
Solution:
Step 1. Sketch the normal curve.
A
A1
A₂
Step 2. Let A = area between z = -1.35 and z = 2.35
A₁ = area between z = 0 and z = -1.35
Az = area between z = 0 and z = 2.35
From the table,
A₁ = 0.4114
A₂ = 0.4906
A = A₁ + A₂
= 0.4114 +0.4906
A = 0.902
Hence, the area between z = -1.35 and z = 2.35 is 0.902.
A₁
2.35
Example 6. Find the area to the left of z = 2.32.
Solution:
Step 1. Sketch the normal curve.
2.32
Step 2. Let A area to the left of z = 2.32
A₁ = area of half of the curve
A₂ = area between z = 0 and z = 2.32
From the table,
A2 0.4898
A = A₁ + A₂
= 0.5 +0.4898
A= 0.9898
Hence, the area to the left of z = 2.32 is 0.9898.
Practice/Exercises: Find the area under the normal curve in each of the following cases:
1. Between z = 0 and z= 1.63
2. Between z = 1.56 and z = 2.51
3. Between z = -2.46 and z= 1.55
4. To the right of z = 2.35
5. To the left of z=0.35
BIU Y 8
A
Az
!!!
...
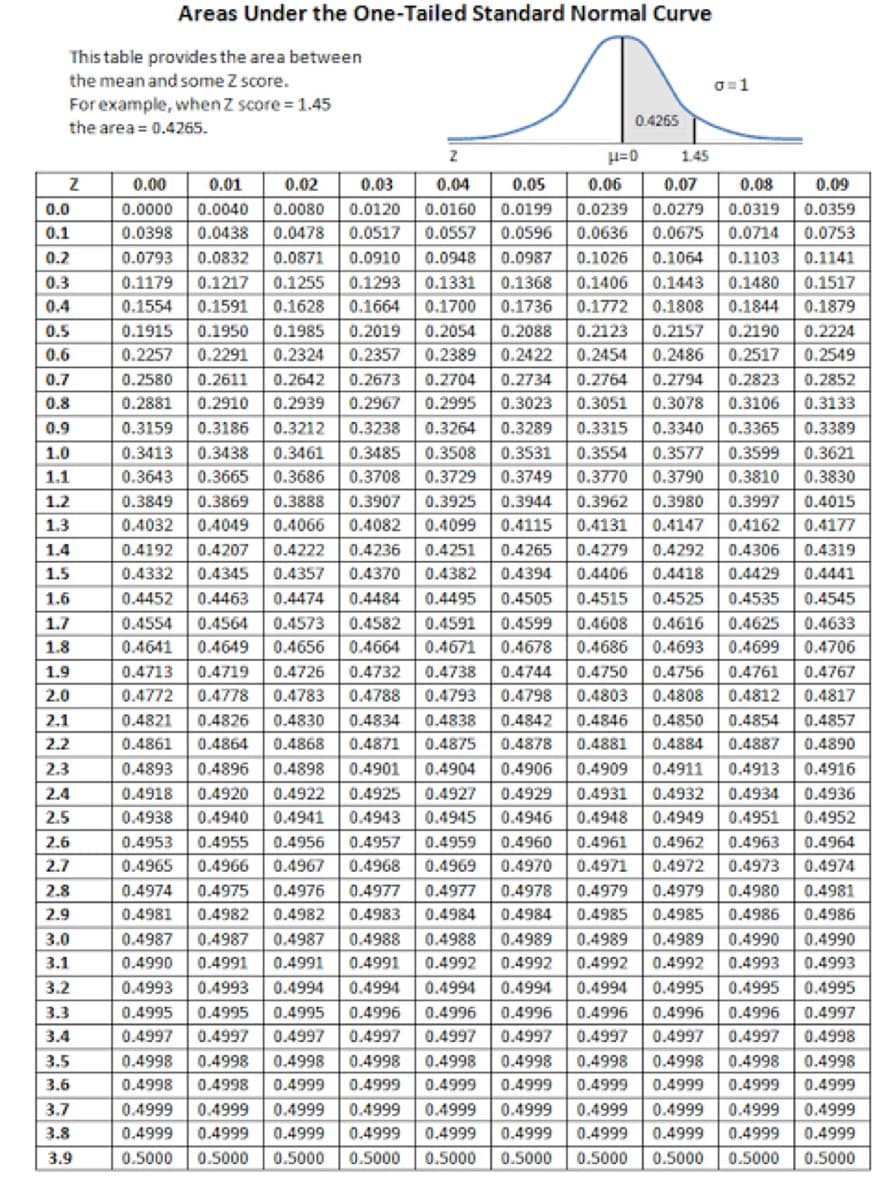
Transcribed Image Text:Areas Under the One-Tailed Standard Normal Curve
This table provides the area between
the mean and some Z score.
0=1
For example, when Z score=1.45
the area = 0.4265.
0.4265
Z
Z
0.00
0.01
0.02
0.06
0.09
0.05
0.0199 0.0239
0.0000 0.0040
0.0359
0.0080
0.0478 0.0517
0.0398 0.0438
0.03 0.04
0.0120 0.0160
0.0557
0.0948 0.0987 0.1026
0.1331
0.0596 0.0636
0.0753
0.0793 0.0832 0.0871
0.0910
0.1103 0.1141
0.1179 0.1217 0.1255
0.1293
0.1064
0.1368 0.1406 0.1443
0.1808
0.1480
0.1517
0.1554
0.1591 0.1628
0.1664
0.1700
0.1736 0.1772
0.1844 0.1879
0.1915
0.1950
0.1985
0.2019 0.2054
0.2088 0.2123
0.2157
0.2190
0.2224
0.2257
0.2291
0.2324
0.2357
0.2454 0.2486
0.2517
0.2549
0.2580 0.2611
0.2642
0.2673 0.2704
0.2764 0.2794
0.2823
0.2852
0.2734
0.3023 0.3051 0.3078 0.3106
0.2881 0.2910
0.2939
0.2967
0.2995
0.3133
0.3159 0.3186 0.3212
0.3238 0.3264
0.3289 0.3315 0.3340
0.3365
0.3389
0.3413 0.3438
0.3508
0.3554 0.3577 0.3599
0.3621
0.3643 0.3665 0.3686
0.3790 0.3810
0.3830
0.3708 0.3729
0.3907 0.3925
0.4082 0.4099
0.3531
0.3749 0.3770
0.3944 0.3962
0.4115 0.4131
0.3980 0.3997
0.4015
0.4147 0.4162
0.4177
0.3849 0.3869 0.3888
0.4032 0.4049 0.4066
0.4192 0.4207 0.4222
0.4332 0.4345 0.4357
0.4452 0.4463 0.4474 0.4484 0.4495
0.4236 0.4251
0.4292 0.4306
0.4319
0.4265 0.4279
0.4394 0.4406
0.4370 0.4382
0.4418 0.4429
0.4441
0.4505 0.4515
0.4525 0.4535 0.4545
0.4582 0.4591
0.4599 0.4608
0.4641 0.4649
0.4671
0.4678 0.4686
0.4616 0.4625 0.4633
0.4693 0.4699 0.4706
0.4744 0.4750 0.4756 0.4761
0.4554 0.4564 0.4573
0.4656 0.4664
0.4719 0.4726 0.4732
0.4772 0.4778 0.4783 0.4788
0.4713
0.4767
0.4817
0.4857
0.4830 0.4834
0.4868 0.4871
0.4881 0.4884 0.4887
0.4890
0.4916
0.4909 0.4911 0.4913
0.4931 0.4932 0.4934
0.4918 0.4920
0.4936
0.4948
0.4949 0.4951 0.4952
0.4738
0.4793 0.4798 0.4803 0.4808 0.4812
0.4821 0.4826
0.4838 0.4842 0.4846 0.4850 0.4854
0.4861 0.4864
0.4875 0.4878
0.4893 0.4896 0.4898 0.4901 0.4904 0.4906
0.4922 0.4925 0.4927 0.4929
0.4938 0.4940 0.4941 0.4943 0.4945 0.4946
0.4953 0.4955 0.4956 0.4957 0.4959 0.4960
0.4965 0.4966 0.4967 0.4968 0.4969
0.4974 0.4975 0.4976 0.4977 0.4977
0.4981
0.4981 0.4982 0.4982 0.4983 0.4984
0.4985 0.4986 0.4986
0.4987 0.4987 0.4987 0.4988 0.4988 0.4989 0.4989 0.4989 0.4990 0.4990
0.4990 0.4991 0.4991 0.4991 0.4992 0.4992 0.4992 0.4992 0.4993 0.4993
0.4993 0.4993 0.4994 0.4994 0.4994 0.4994 0.4994 0.4995 0.4995
0.4995 0.4995 0.4995 0.4996 0.4996 0.4996 0.4996 0.4996 0.4996
0.4997 0.4997 0.4997 0.4997
0.4998 0.4998 0.4998 0.4998
0.4961
0.4970 0.4971
0.4962 0.4963 0.4964
0.4974
0.4972 0.4973
0.4979 0.4980
0.4978 0.4979
0.4984 0.4985
0.4995
0.4997
0.4997 0.4997
0.4997 0.4997 0.4997
0.4998
0.4998 0.4998
0.4998 0.4998 0.4998
0.4998
0.4998 0.4998
0.4999
0.4999
0.4999 0.4999 0.4999
0.4999 0.4999 0.4999
0.4999 0.4999 0.4999
0.4999 0.4999 0.4999 0.4999 0.4999 0.4999
0.4999 0.4999 0.4999 0.4999 0.4999 0.4999
0.5000 0.5000 0.5000 0.5000 0.5000 0.5000
0.4999
0.4999 0.4999 0.4999 0.4999
0.5000 0.5000
0.5000 0.5000
0.0
0.1
0.2
0.3
0.4
0.5
0.6
0.7
0.8
0.9
1.0
1.1
1.2
1.3
1.4
1.5
1.6
1.7
1.8
1.9
2.0
2.1
2.2
2.3
2.4
2.5
2.6
2.7
2.8
2.9
3.0
3.1
3.2
3.4
3.5
3.6
3.7
3.8
3.9
0.3461 0.3485
0.2389 0.2422
H=0
1.45
0.07
0.08
0.0279 0.0319
0.0675 0.0714
Jalale
Expert Solution
This question has been solved!
Explore an expertly crafted, step-by-step solution for a thorough understanding of key concepts.

Step by step
Solved in 2 steps with 3 images

Recommended textbooks for you
Algebra & Trigonometry with Analytic Geometry
Algebra
ISBN:
9781133382119
Author:
Swokowski
Publisher:
Cengage

Functions and Change: A Modeling Approach to Coll…
Algebra
ISBN:
9781337111348
Author:
Bruce Crauder, Benny Evans, Alan Noell
Publisher:
Cengage Learning

Linear Algebra: A Modern Introduction
Algebra
ISBN:
9781285463247
Author:
David Poole
Publisher:
Cengage Learning
Algebra & Trigonometry with Analytic Geometry
Algebra
ISBN:
9781133382119
Author:
Swokowski
Publisher:
Cengage
Functions and Change: A Modeling Approach to Coll…
Algebra
ISBN:
9781337111348
Author:
Bruce Crauder, Benny Evans, Alan Noell
Publisher:
Cengage Learning
Linear Algebra: A Modern Introduction
Algebra
ISBN:
9781285463247
Author:
David Poole
Publisher:
Cengage Learning