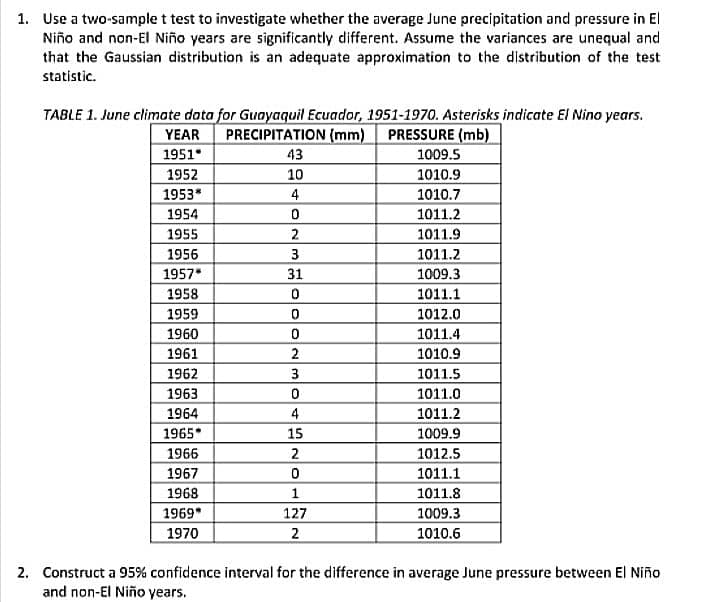
1. Use a two-sample t test to investigate whether the average June precipitation and pressure in El Niño and non-El Niño years are significantly different. Assume the variances are unequal and that the Gaussian distribution is an adequate approximation to the distribution of the test statistic. TABLE 1. June climate data for Guayaquil Ecuador, 1951-1970. Asterisks indicate El Nino years. PRECIPITATION (mm) PRESSURE (mb) YEAR 1951 43 1009.5 1952 10 1010.9 1953* 4 1010.7 1954 1011.2 1955 2 1011.9 1956 3 1011.2 31 1009.3 1011.1 1012.0 1957* 1958 1959 1960 1011.4 1961 2 1010.9 1962 3 1011.5 1963 1011.0 1964 1965 1011.2 1009.9 4 15 1966 2 1012.5 1967 1011.1 1968 1 1011.8 1969* 127 1009.3 1970 2 1010.6 2. Construct a 95% confidence interval for the difference in average June pressure between El Niño and non-El Niño years.
1. Use a two-sample t test to investigate whether the average June precipitation and pressure in El Niño and non-El Niño years are significantly different. Assume the variances are unequal and that the Gaussian distribution is an adequate approximation to the distribution of the test statistic. TABLE 1. June climate data for Guayaquil Ecuador, 1951-1970. Asterisks indicate El Nino years. PRECIPITATION (mm) PRESSURE (mb) YEAR 1951 43 1009.5 1952 10 1010.9 1953* 4 1010.7 1954 1011.2 1955 2 1011.9 1956 3 1011.2 31 1009.3 1011.1 1012.0 1957* 1958 1959 1960 1011.4 1961 2 1010.9 1962 3 1011.5 1963 1011.0 1964 1965 1011.2 1009.9 4 15 1966 2 1012.5 1967 1011.1 1968 1 1011.8 1969* 127 1009.3 1970 2 1010.6 2. Construct a 95% confidence interval for the difference in average June pressure between El Niño and non-El Niño years.

Glencoe Algebra 1, Student Edition, 9780079039897, 0079039898, 2018
18th Edition
ISBN:9780079039897
Author:Carter
Publisher:Carter
Chapter10: Statistics
Section10.4: Distributions Of Data
Problem 19PFA

Related questions
Question
Statistical Methods in Atmospheric Science
Transcribed Image Text:1. Use a two-sample t test to investigate whether the average June precipitation and pressure in El
Niño and non-El Niño years are significantly different. Assume the variances are unequal and
that the Gaussian distribution is an adequate approximation to the distribution of the test
statistic.
TABLE 1. June climate data for Guayaquil Ecuador, 1951-1970. Asterisks indicate El Nino years.
PRECIPITATION (mm)
PRESSURE (mb)
YEAR
1951
43
1009.5
1952
10
1010.9
1953*
4
1010.7
1954
1011.2
1955
1011.9
1956
3
1011.2
1957*
31
1009.3
1958
1011.1
1012.0
1959
1960
1011.4
1961
1010.9
1962
3
1011.5
1963
1011.0
1964
1965
1011.2
1009.9
4
15
1966
2
1012.5
1967
1011.1
1968
1
1011.8
1969*
127
1009.3
1970
2
1010.6
2. Construct a 95% confidence interval for the difference in average June pressure between El Niño
and non-El Niño years.
Expert Solution
This question has been solved!
Explore an expertly crafted, step-by-step solution for a thorough understanding of key concepts.

Step by step
Solved in 2 steps with 2 images

Recommended textbooks for you
Glencoe Algebra 1, Student Edition, 9780079039897…
Algebra
ISBN:
9780079039897
Author:
Carter
Publisher:
McGraw Hill
Glencoe Algebra 1, Student Edition, 9780079039897…
Algebra
ISBN:
9780079039897
Author:
Carter
Publisher:
McGraw Hill