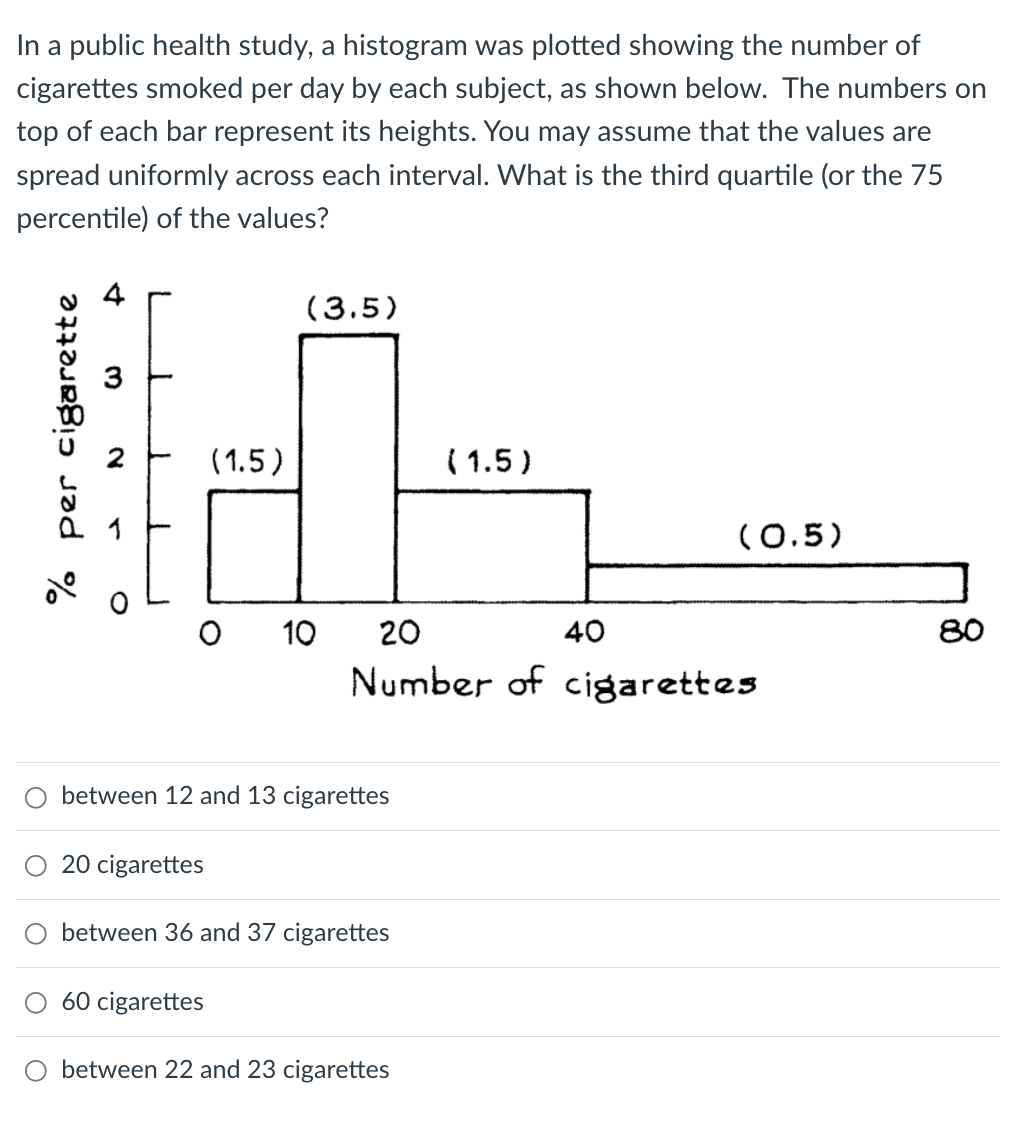
In a public health study, a histogram was plotted showing the number of cigarettes smoked per day by each subject, as shown below. The numbers on top of each bar represent its heights. You may assume that the values are spread uniformly across each interval. What is the third quartile (or the 75 percentile) of the values?
In a public health study, a histogram was plotted showing the number of cigarettes smoked per day by each subject, as shown below. The numbers on top of each bar represent its heights. You may assume that the values are spread uniformly across each interval. What is the third quartile (or the 75 percentile) of the values?

Mathematics For Machine Technology
8th Edition
ISBN:9781337798310
Author:Peterson, John.
Publisher:Peterson, John.
Chapter29: Tolerance, Clearance, And Interference
Section: Chapter Questions
Problem 16A: Spacers are manufactured to the mean dimension and tolerance shown in Figure 29-12. An inspector...

Related questions
Question
Transcribed Image Text:In a public health study, a histogram was plotted showing the number of
cigarettes smoked per day by each subject, as shown below. The numbers on
top of each bar represent its heights. You may assume that the values are
spread uniformly across each interval. What is the third quartile (or the 75
percentile) of the values?
(3.5)
(1.5)
( 1.5)
(0.5)
10
20
40
80
Number of cigarettes
between 12 and 13 cigarettes
20 cigarettes
O between 36 and 37 cigarettes
60 cigarettes
between 22 and 23 cigarettes
4.
3.
% per cigarette
Expert Solution
This question has been solved!
Explore an expertly crafted, step-by-step solution for a thorough understanding of key concepts.

This is a popular solution!

Trending now
This is a popular solution!

Step by step
Solved in 2 steps

Recommended textbooks for you
Mathematics For Machine Technology
Advanced Math
ISBN:
9781337798310
Author:
Peterson, John.
Publisher:
Cengage Learning,

Glencoe Algebra 1, Student Edition, 9780079039897…
Algebra
ISBN:
9780079039897
Author:
Carter
Publisher:
McGraw Hill
Mathematics For Machine Technology
Advanced Math
ISBN:
9781337798310
Author:
Peterson, John.
Publisher:
Cengage Learning,
Glencoe Algebra 1, Student Edition, 9780079039897…
Algebra
ISBN:
9780079039897
Author:
Carter
Publisher:
McGraw Hill