1. Use the data given to solve the following problems. Savings needed for Health-Care Expenses During Retirement Age at Death Savings Needed 80 $219,000 85 $307,000 90 $409,000 95 $524,000 100 $656,000 Source: Employee Benefit Research Institute a.) Use a graphing calculator or Desmos to create a scatterplot of the data. Upload an image of that b.) Use the graphing utility's regression option to compare the following models: y=ab, y= a + blnx, y= ax+b, and y = axº. Submit a sketch or image of each. c.) Discuss how each of the regression curves in part b fit the data by looking at the correlation constant r.
1. Use the data given to solve the following problems. Savings needed for Health-Care Expenses During Retirement Age at Death Savings Needed 80 $219,000 85 $307,000 90 $409,000 95 $524,000 100 $656,000 Source: Employee Benefit Research Institute a.) Use a graphing calculator or Desmos to create a scatterplot of the data. Upload an image of that b.) Use the graphing utility's regression option to compare the following models: y=ab, y= a + blnx, y= ax+b, and y = axº. Submit a sketch or image of each. c.) Discuss how each of the regression curves in part b fit the data by looking at the correlation constant r.

MATLAB: An Introduction with Applications
6th Edition
ISBN:9781119256830
Author:Amos Gilat
Publisher:Amos Gilat
Chapter1: Starting With Matlab
Section: Chapter Questions
Problem 1P

Related questions
Question
Answer letter D of this problem. Use the link for reference.
https://www.bartleby.com/questions-and-answers/use-the-data-given-to-solve-the-following-problems.-savings-needed-for-health-care-expenses-during-r/bb9b5877-4060-4842-9d0d-d6cd31ed7389
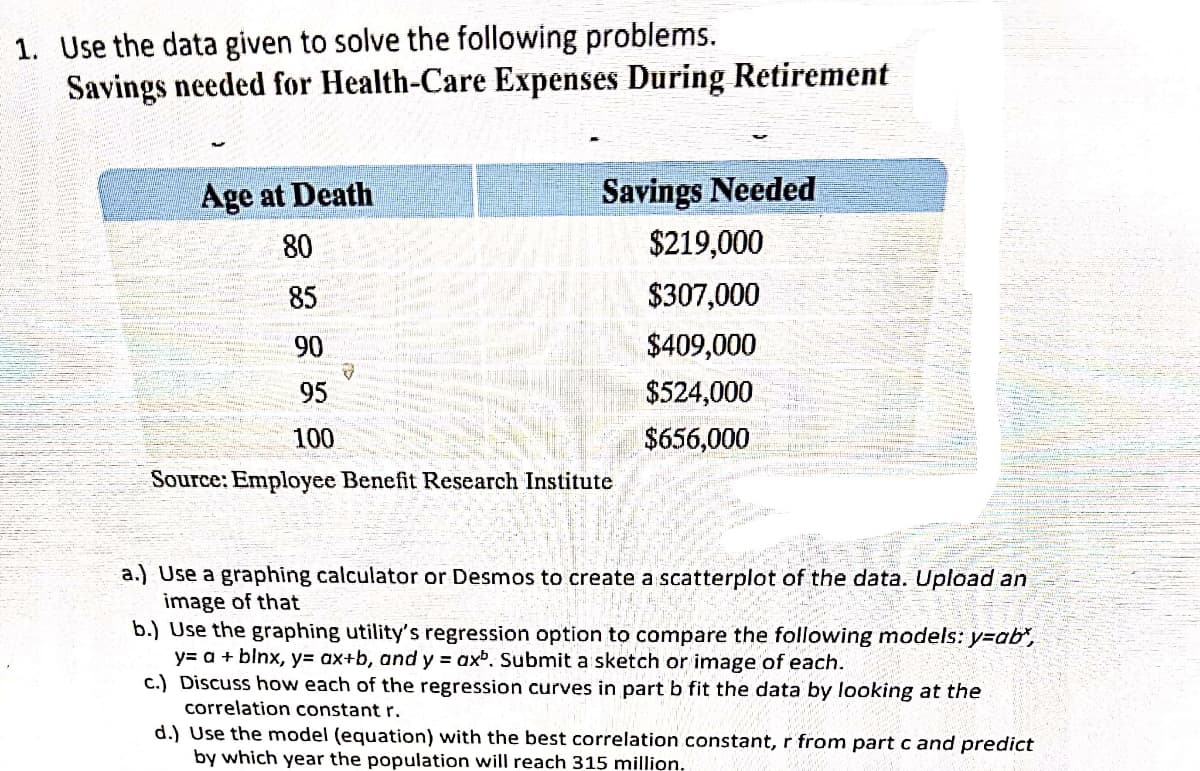
Transcribed Image Text:1. Use the data given to solve the following problems.
Savings needed for Health-Care Expenses During Retirement
Age at Death
Savings Needed
80
$219,000
85
$307,000
90
$409,000
95
$524,000
100
$656,000
Source: Employee Benefit Research Institute
a.) Use a graphing calculator or Desmos to create a scatterplot of the data. Upload an
image of that
b.) Use the graphing utility's regression option to compare the following models: y=ab",
y= a + blnx, y= ax+b, and y = axb. Submit a sketch or image of each.
c.) Discuss how each of the regression curves in part b fit the data by looking at the
correlation constant r.
d.) Use the model (equation) with the best correlation constant, r from part c and predict
by which year the population will reach 315 million.
Expert Solution
This question has been solved!
Explore an expertly crafted, step-by-step solution for a thorough understanding of key concepts.

Step by step
Solved in 6 steps with 8 images

Recommended textbooks for you
MATLAB: An Introduction with Applications
Statistics
ISBN:
9781119256830
Author:
Amos Gilat
Publisher:
John Wiley & Sons Inc

Probability and Statistics for Engineering and th…
Statistics
ISBN:
9781305251809
Author:
Jay L. Devore
Publisher:
Cengage Learning

Statistics for The Behavioral Sciences (MindTap C…
Statistics
ISBN:
9781305504912
Author:
Frederick J Gravetter, Larry B. Wallnau
Publisher:
Cengage Learning
MATLAB: An Introduction with Applications
Statistics
ISBN:
9781119256830
Author:
Amos Gilat
Publisher:
John Wiley & Sons Inc
Probability and Statistics for Engineering and th…
Statistics
ISBN:
9781305251809
Author:
Jay L. Devore
Publisher:
Cengage Learning
Statistics for The Behavioral Sciences (MindTap C…
Statistics
ISBN:
9781305504912
Author:
Frederick J Gravetter, Larry B. Wallnau
Publisher:
Cengage Learning

Elementary Statistics: Picturing the World (7th E…
Statistics
ISBN:
9780134683416
Author:
Ron Larson, Betsy Farber
Publisher:
PEARSON

The Basic Practice of Statistics
Statistics
ISBN:
9781319042578
Author:
David S. Moore, William I. Notz, Michael A. Fligner
Publisher:
W. H. Freeman

Introduction to the Practice of Statistics
Statistics
ISBN:
9781319013387
Author:
David S. Moore, George P. McCabe, Bruce A. Craig
Publisher:
W. H. Freeman