1. Using year-end balances for all ratios, compute the t

Century 21 Accounting General Journal
11th Edition
ISBN:9781337680059
Author:Gilbertson
Publisher:Gilbertson
Chapter17: Financial Statement Analysis
Section: Chapter Questions
Problem 4AP

Related questions
Question
Transcribed Image Text:1
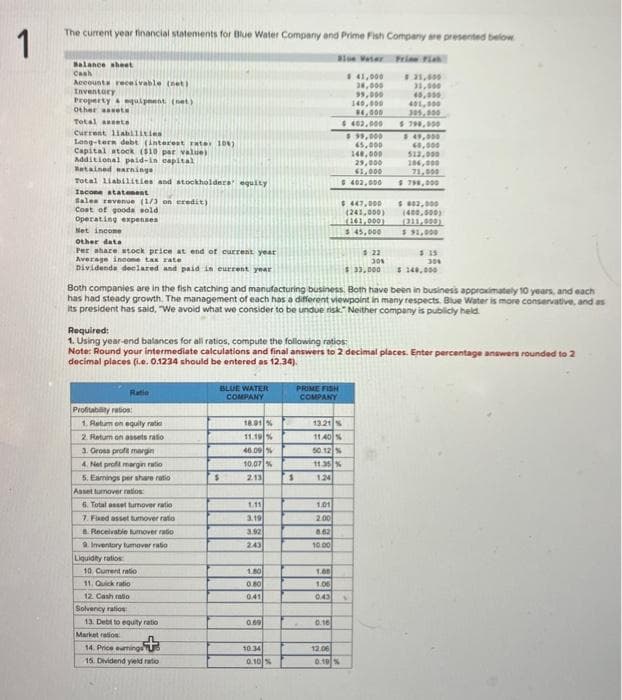
The current year financial statements for Blue Water Company and Prime Fish Company are presented below
Balance sheet
Cash
Accounts receivable (net)
Inventory
Property & equipment (net)
Other asset
Total assets
Current liabilities
Long-term debt (interest rate: 106)
Capital stock ($10 per value)
Additional paid-in capital
Retained earnings
Total liabilities and stockholders' equity
Iscome statement
Sales revenue (1/3 on credit)
Cost of goods sold
Operating expenses
Net incor
Other date
Per share stock price at end of current year
Average income tax rate
Dividends declared and paid is current year
Profitability ration:
Required:
1. Using year-end balances for all ratios, compute the following ratios:
Ratin
1. Retum on equity ratio
on assets ratio
3. Gross profit margin
4. Net profit margin ratio
5. Earnings per share ratio
Asset lumover ratios:
6. Total asset turnover ratio
7. Fixed asset tumover ratio
8. Receivable tumover ratio
9. Inventory tumover ratio
Liquidity ratios
10. Current ratio
11. Quick ratio :
12. Cash ratio
Solvency ratios
13. Debt to equity ratio
Market radios
Both companies are in the fish catching and manufacturing business. Both have been in business approximately 10 years, and each
has had steady growth. The management of each has a different viewpoint in many respects. Blue Water is more conservative, and as
its president has said, "We avoid what we consider to be undue risk. Neither company is publicly held.
14. Price eurings
15. Dividend yield ratio
BLUE WATER
COMPANY
Note: Round your intermediate calculations and final answers to 2 decimal places. Enter percentage answers rounded to 2
decimal places (ie. 0.1234 should be entered as 12.34).
$
18.91 %
11.19%
46.09%
10.07%
2.13
1.11
3.19
3.92
243
1.80
0.80
0.41
0.69
10.34
0.10%
S
PRIME FISH
COMPANY
1.01
2.00
13.21 %
11.40%
50.12 %
11.35 %
124
8.62
10.00
1.60
1.06
043
$ 41,000
38,000
95,000
140,000
$4,000
$400,000
$ 99,000
65,000
140,000
29,000
61,000
$ 402,000
0.16
$.447,000
(241,000)
161,000
$ 45,000
12.06
0.19%
$ 33,000
1:22
30%
$ 21,909
31,000
45,000
401,000
305,000
$ 790,000
A
49,000
40,000
512,000
106,000
71,000
$ 798,000
$ 602,000
(400,000)
(311,000)
$ $1,000
$ 15
30%
$ 140,000
Expert Solution
This question has been solved!
Explore an expertly crafted, step-by-step solution for a thorough understanding of key concepts.

Step by step
Solved in 4 steps

Knowledge Booster


Learn more about
Need a deep-dive on the concept behind this application? Look no further. Learn more about this topic, accounting and related others by exploring similar questions and additional content below.Recommended textbooks for you

Intermediate Accounting: Reporting And Analysis
Accounting
ISBN:
9781337788281
Author:
James M. Wahlen, Jefferson P. Jones, Donald Pagach
Publisher:
Cengage Learning

Cornerstones of Financial Accounting
Accounting
ISBN:
9781337690881
Author:
Jay Rich, Jeff Jones
Publisher:
Cengage Learning
Intermediate Accounting: Reporting And Analysis
Accounting
ISBN:
9781337788281
Author:
James M. Wahlen, Jefferson P. Jones, Donald Pagach
Publisher:
Cengage Learning
Cornerstones of Financial Accounting
Accounting
ISBN:
9781337690881
Author:
Jay Rich, Jeff Jones
Publisher:
Cengage Learning

Managerial Accounting: The Cornerstone of Busines…
Accounting
ISBN:
9781337115773
Author:
Maryanne M. Mowen, Don R. Hansen, Dan L. Heitger
Publisher:
Cengage Learning

Managerial Accounting
Accounting
ISBN:
9781337912020
Author:
Carl Warren, Ph.d. Cma William B. Tayler
Publisher:
South-Western College Pub

Financial Accounting
Accounting
ISBN:
9781337272124
Author:
Carl Warren, James M. Reeve, Jonathan Duchac
Publisher:
Cengage Learning