1. What is the Pearson r correlation coefficient? (answer in 4 decimal places) 2. Which of the following is an appropriate conclusion for these samples? (input the letter of your answer)
1. What is the Pearson r correlation coefficient? (answer in 4 decimal places) 2. Which of the following is an appropriate conclusion for these samples? (input the letter of your answer)

Glencoe Algebra 1, Student Edition, 9780079039897, 0079039898, 2018
18th Edition
ISBN:9780079039897
Author:Carter
Publisher:Carter
Chapter10: Statistics
Section10.4: Distributions Of Data
Problem 19PFA

Related questions
Question
100%
The following table shows the number of siblings and daily allowance of 12 students from a Grade 11 class:
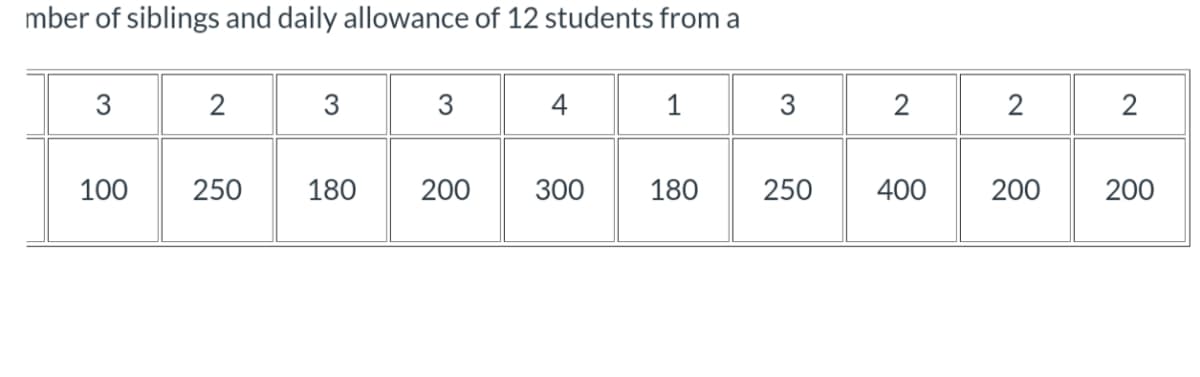
Transcribed Image Text:mber of siblings and daily allowance of 12 students from a
3
100
2
250
3
180
3
200
4
1
300 180
3
250
2
400
2
200
2
200
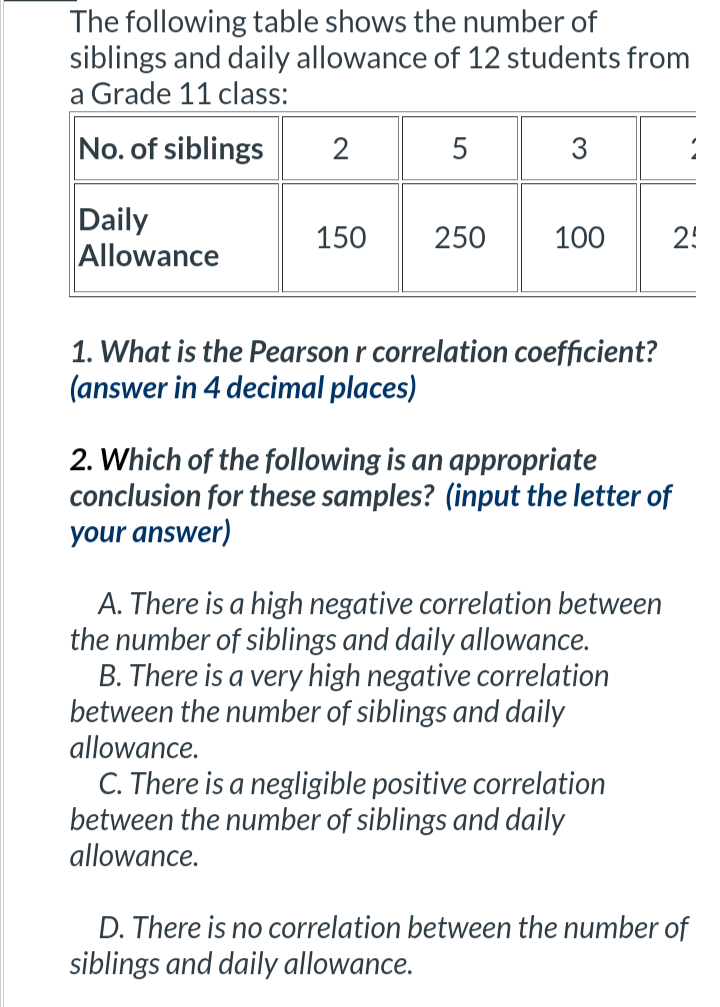
Transcribed Image Text:The following table shows the number of
siblings and daily allowance of 12 students from
a Grade 11 class:
No. of siblings
Daily
Allowance
2
150
5
3
250 100 2!
1. What is the Pearson r correlation coefficient?
(answer in 4 decimal places)
2. Which of the following is an appropriate
conclusion for these samples? (input the letter of
your answer)
A. There is a high negative correlation between
the number of siblings and daily allowance.
B. There is a very high negative correlation
between the number of siblings and daily
allowance.
C. There is a negligible positive correlation
between the number of siblings and daily
allowance.
D. There is no correlation between the number of
siblings and daily allowance.
Expert Solution
This question has been solved!
Explore an expertly crafted, step-by-step solution for a thorough understanding of key concepts.

Step by step
Solved in 2 steps with 2 images

Recommended textbooks for you
Glencoe Algebra 1, Student Edition, 9780079039897…
Algebra
ISBN:
9780079039897
Author:
Carter
Publisher:
McGraw Hill
Glencoe Algebra 1, Student Edition, 9780079039897…
Algebra
ISBN:
9780079039897
Author:
Carter
Publisher:
McGraw Hill