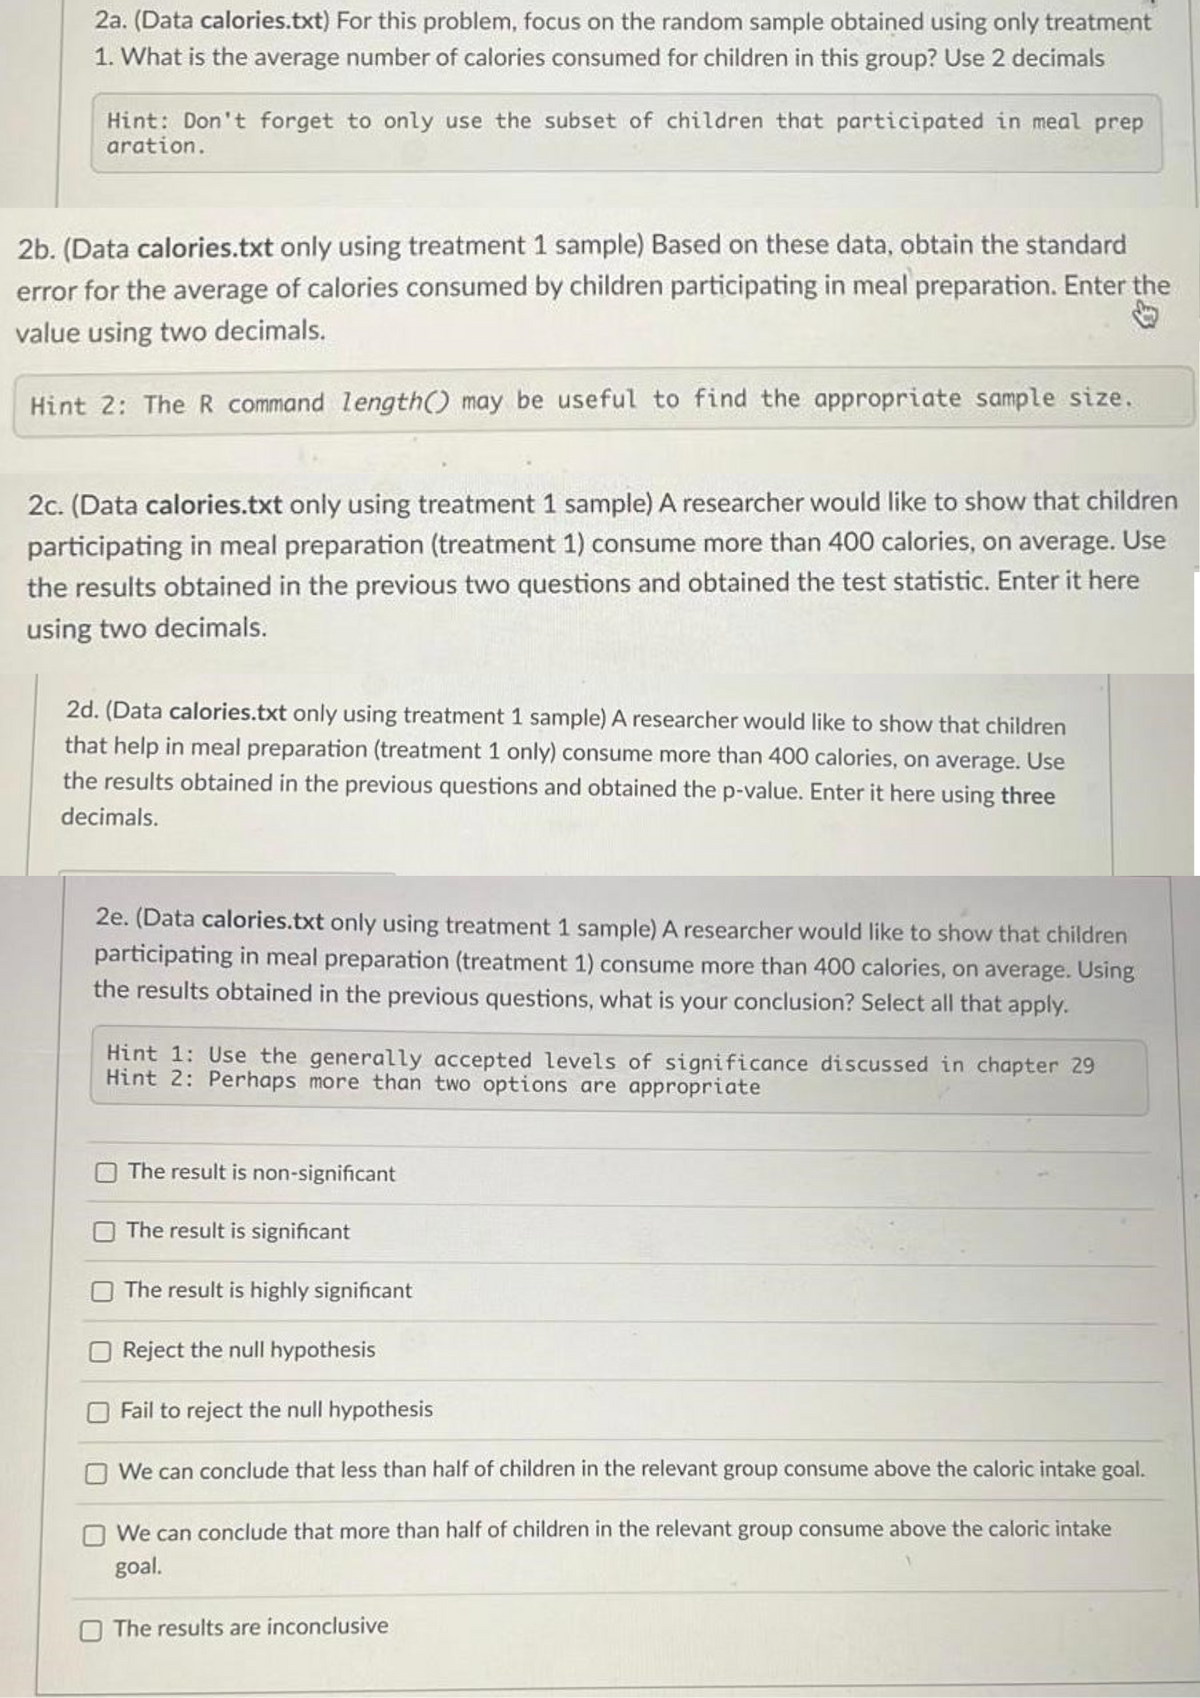
2a. (Data calories.txt) For this problem, focus on the random sample obtained using only treatment 1. What is the average number of calories consumed for children in this group? Use 2 decimals Hint: Don't forget to only use the subset of children that participated in meal prep aration. 2b. (Data calories.txt only using treatment 1 sample) Based on these data, obtain the standard error for the average of calories consumed by children participating in meal preparation. Enter the value using two decimals. Hint 2: The R command length() may be useful to find the appropriate sample size. 2c. (Data calories.txt only using treatment 1 sample) A researcher would like to show that children participating in meal preparation (treatment 1) consume more than 400 calories, on average. Use the results obtained in the previous two questions and obtained the test statistic. Enter it here using two decimals. 2d. (Data calories.txt only using treatment 1 sample) A researcher would like to show that children that help in meal preparation (treatment 1 only) consume more than 400 calories, on average. Use the results obtained in the previous questions and obtained the p-value. Enter it here using three decimals. 2e. (Data calories.txt only using treatment 1 sample) A researcher would like to show that children participating in meal preparation (treatment 1) consume more than 400 calories, on average. Using the results obtained in the previous questions, what is your conclusion? Select all that apply. Hint 1: Use the generally accepted levels of significance discussed in chapter 29 Hint 2: Perhaps more than two options are appropriate The result is non-significant The result is significant The result is highly significant Reject the null hypothesis Fail to reject the null hypothesis We can conclude that less than half of children in the relevant group consume above the caloric intake goal. We can conclude that more than half of children in the relevant group consume above the caloric intake goal. The results are inconclusive "Trt" "Calories" "1" 1 435.16 "2" 1 338.99 "3" 1 488.73 "4" 1 590.28 "5" 1 582.59 "6" 1 635.21 "7" 1 249.86 "8" 1 441.66 "9" 1 572.43 "10" 1 357.78 "11" 1 396.79 "12" 1 298.38 "13" 1 282.99 "14" 1 368.51 "15" 1 388.59 "16" 1 256.32 "17" 1 408.82 "18" 1 424.94 "19" 1 477.96 "20" 1 428.74 "21" 1 432.52 "22" 1 428.27 "23" 1 596.79 "24" 1 456.3 "25" 1 446.38 "26" 2 414.61 "27" 2 503.46 "28" 2 425.22 "29" 2 288.77 "30" 2 184 "31" 2 299.73 "32" 2 350.65 "33" 2 394.94 "34" 2 261.55 "35" 2 295.28 "36" 2 139.69 "37" 2 462.78 "38" 2 179.59 "39" 2 301.75 "40" 2 436.58 "41" 2 371.39 "42" 2 469.02 "43" 2 378.09 "44" 2 287.31 "45" 2 448.55 "46" 2 332.64 "47" 2 403.98 2f. (Data calories.txt only using treatment 1 sample) Using the results obtained in the previous questions, obtain a 98% confidence interval for the average of calories consumed by children participating in meal preparation (treatment 1). What is the lower bound? Use one decimal. 2g. (Data calories.txt only using treatment 1 sample) Using the results obtained in the previous questions, obtain a 98% confidence interval for the average of calories consumed by children participating in meal preparation (treatment 1). What is the upper bound? Use one decimal.
2a. (Data calories.txt) For this problem, focus on the random sample obtained using only treatment 1. What is the average number of calories consumed for children in this group? Use 2 decimals Hint: Don't forget to only use the subset of children that participated in meal prep aration. 2b. (Data calories.txt only using treatment 1 sample) Based on these data, obtain the standard error for the average of calories consumed by children participating in meal preparation. Enter the value using two decimals. Hint 2: The R command length() may be useful to find the appropriate sample size. 2c. (Data calories.txt only using treatment 1 sample) A researcher would like to show that children participating in meal preparation (treatment 1) consume more than 400 calories, on average. Use the results obtained in the previous two questions and obtained the test statistic. Enter it here using two decimals. 2d. (Data calories.txt only using treatment 1 sample) A researcher would like to show that children that help in meal preparation (treatment 1 only) consume more than 400 calories, on average. Use the results obtained in the previous questions and obtained the p-value. Enter it here using three decimals. 2e. (Data calories.txt only using treatment 1 sample) A researcher would like to show that children participating in meal preparation (treatment 1) consume more than 400 calories, on average. Using the results obtained in the previous questions, what is your conclusion? Select all that apply. Hint 1: Use the generally accepted levels of significance discussed in chapter 29 Hint 2: Perhaps more than two options are appropriate The result is non-significant The result is significant The result is highly significant Reject the null hypothesis Fail to reject the null hypothesis We can conclude that less than half of children in the relevant group consume above the caloric intake goal. We can conclude that more than half of children in the relevant group consume above the caloric intake goal. The results are inconclusive "Trt" "Calories" "1" 1 435.16 "2" 1 338.99 "3" 1 488.73 "4" 1 590.28 "5" 1 582.59 "6" 1 635.21 "7" 1 249.86 "8" 1 441.66 "9" 1 572.43 "10" 1 357.78 "11" 1 396.79 "12" 1 298.38 "13" 1 282.99 "14" 1 368.51 "15" 1 388.59 "16" 1 256.32 "17" 1 408.82 "18" 1 424.94 "19" 1 477.96 "20" 1 428.74 "21" 1 432.52 "22" 1 428.27 "23" 1 596.79 "24" 1 456.3 "25" 1 446.38 "26" 2 414.61 "27" 2 503.46 "28" 2 425.22 "29" 2 288.77 "30" 2 184 "31" 2 299.73 "32" 2 350.65 "33" 2 394.94 "34" 2 261.55 "35" 2 295.28 "36" 2 139.69 "37" 2 462.78 "38" 2 179.59 "39" 2 301.75 "40" 2 436.58 "41" 2 371.39 "42" 2 469.02 "43" 2 378.09 "44" 2 287.31 "45" 2 448.55 "46" 2 332.64 "47" 2 403.98 2f. (Data calories.txt only using treatment 1 sample) Using the results obtained in the previous questions, obtain a 98% confidence interval for the average of calories consumed by children participating in meal preparation (treatment 1). What is the lower bound? Use one decimal. 2g. (Data calories.txt only using treatment 1 sample) Using the results obtained in the previous questions, obtain a 98% confidence interval for the average of calories consumed by children participating in meal preparation (treatment 1). What is the upper bound? Use one decimal.

Holt Mcdougal Larson Pre-algebra: Student Edition 2012
1st Edition
ISBN:9780547587776
Author:HOLT MCDOUGAL
Publisher:HOLT MCDOUGAL
Chapter11: Data Analysis And Probability
Section: Chapter Questions
Problem 8CR

Related questions
Question
part D E F
Transcribed Image Text:2a. (Data calories.txt) For this problem, focus on the random sample obtained using only treatment
1. What is the average number of calories consumed for children in this group? Use 2 decimals
Hint: Don't forget to only use the subset of children that participated in meal prep
aration.
2b. (Data calories.txt only using treatment 1 sample) Based on these data, obtain the standard
error for the average of calories consumed by children participating in meal preparation. Enter the
value using two decimals.
Hint 2: The R command length() may be useful to find the appropriate sample size.
2c. (Data calories.txt only using treatment 1 sample) A researcher would like to show that children
participating in meal preparation (treatment 1) consume more than 400 calories, on average. Use
the results obtained in the previous two questions and obtained the test statistic. Enter it here
using two decimals.
2d. (Data calories.txt only using treatment 1 sample) A researcher would like to show that children
that help in meal preparation (treatment 1 only) consume more than 400 calories, on average. Use
the results obtained in the previous questions and obtained the p-value. Enter it here using three
decimals.
2e. (Data calories.txt only using treatment 1 sample) A researcher would like to show that children
participating in meal preparation (treatment 1) consume more than 400 calories, on average. Using
the results obtained in the previous questions, what is your conclusion? Select all that apply.
Hint 1: Use the generally accepted levels of significance discussed in chapter 29
Hint 2: Perhaps more than two options are appropriate
The result is non-significant
The result is significant
The result is highly significant
Reject the null hypothesis
Fail to reject the null hypothesis
We can conclude that less than half of children in the relevant group consume above the caloric intake goal.
We can conclude that more than half of children in the relevant group consume above the caloric intake
goal.
The results are inconclusive
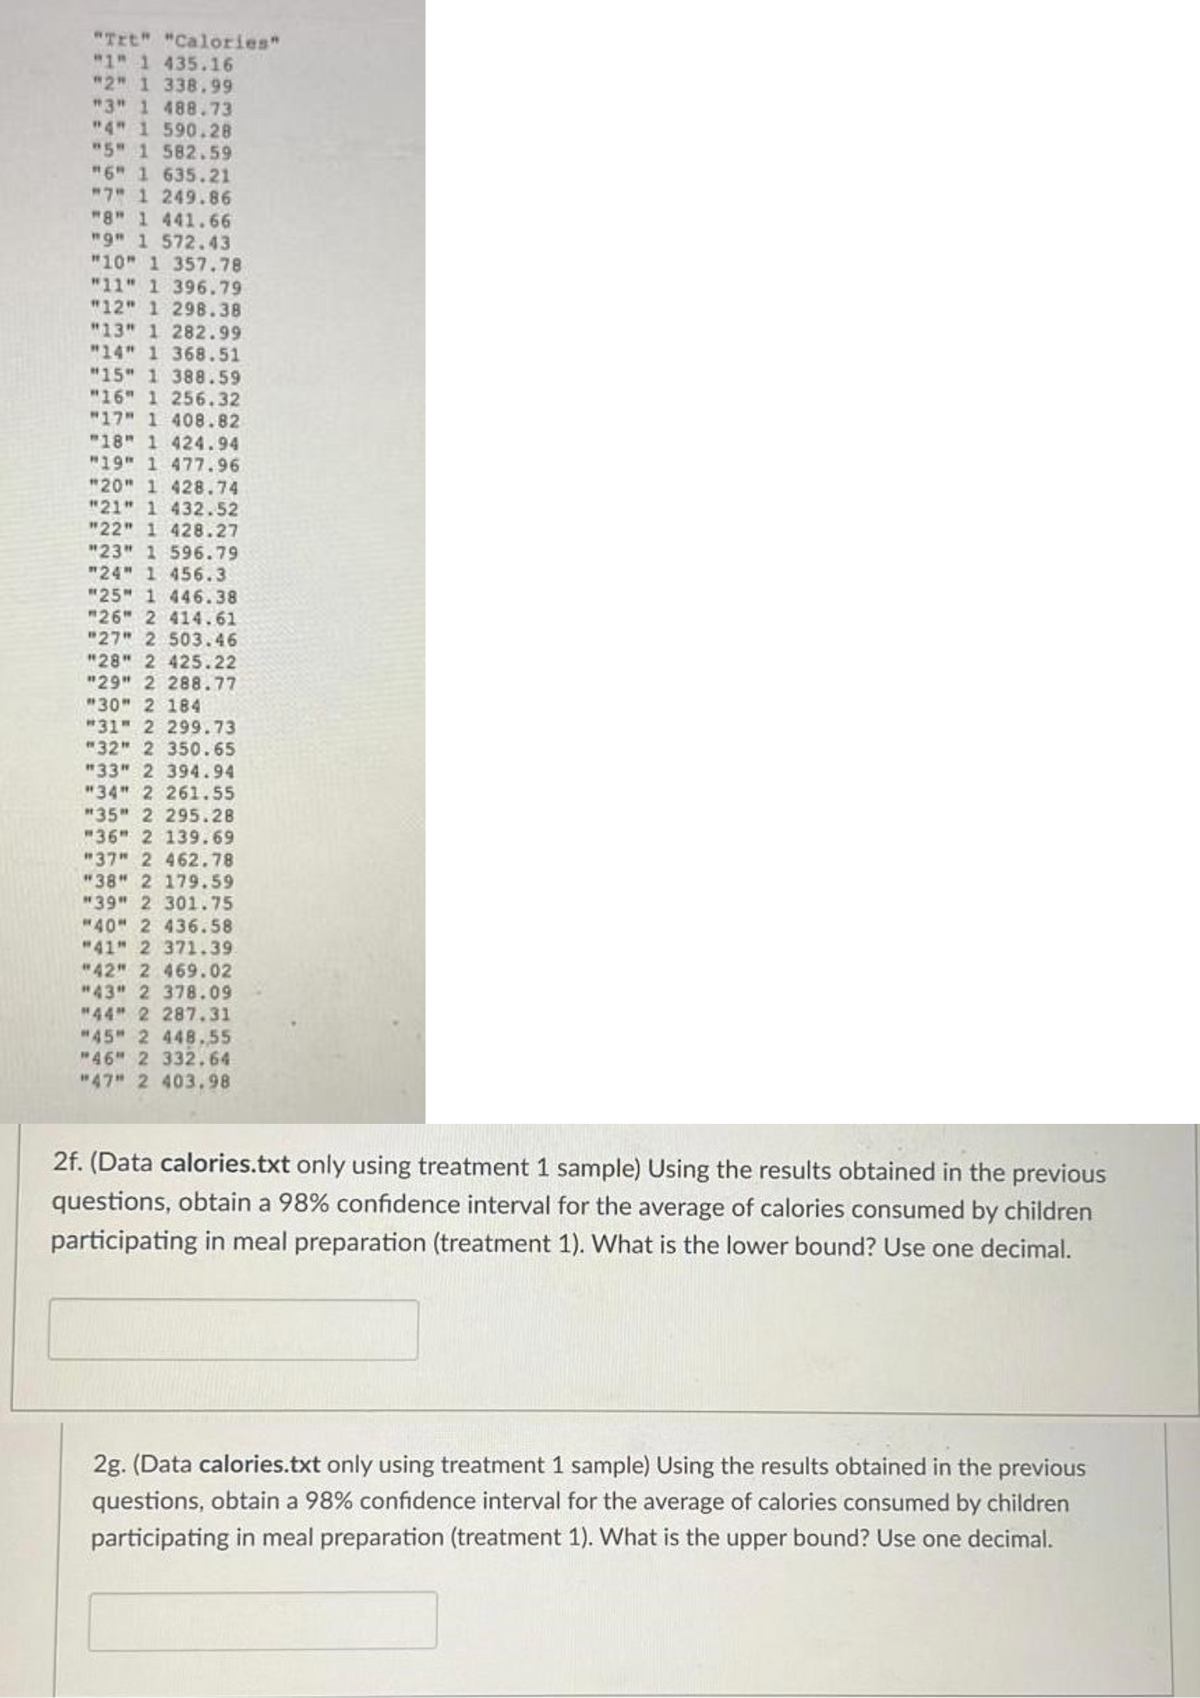
Transcribed Image Text:"Trt" "Calories"
"1" 1 435.16
"2" 1 338.99
"3" 1 488.73
"4" 1 590.28
"5" 1 582.59
"6" 1 635.21
"7" 1 249.86
"8" 1 441.66
"9" 1 572.43
"10" 1 357.78
"11" 1 396.79
"12" 1 298.38
"13" 1 282.99
"14" 1 368.51
"15" 1 388.59
"16" 1 256.32
"17" 1 408.82
"18" 1 424.94
"19" 1 477.96
"20" 1 428.74
"21" 1 432.52
"22" 1 428.27
"23" 1 596.79
"24" 1 456.3
"25" 1 446.38
"26" 2 414.61
"27" 2 503.46
"28" 2 425.22
"29" 2 288.77
"30" 2 184
"31" 2 299.73
"32" 2 350.65
"33" 2 394.94
"34" 2 261.55
"35" 2 295.28
"36" 2 139.69
"37" 2 462.78
"38" 2 179.59
"39" 2 301.75
"40" 2 436.58
"41" 2 371.39
"42" 2 469.02
"43" 2 378.09
"44" 2 287.31
"45" 2 448.55
"46" 2 332.64
"47" 2 403.98
2f. (Data calories.txt only using treatment 1 sample) Using the results obtained in the previous
questions, obtain a 98% confidence interval for the average of calories consumed by children
participating in meal preparation (treatment 1). What is the lower bound? Use one decimal.
2g. (Data calories.txt only using treatment 1 sample) Using the results obtained in the previous
questions, obtain a 98% confidence interval for the average of calories consumed by children
participating in meal preparation (treatment 1). What is the upper bound? Use one decimal.
Expert Solution
This question has been solved!
Explore an expertly crafted, step-by-step solution for a thorough understanding of key concepts.

This is a popular solution!

Trending now
This is a popular solution!

Step by step
Solved in 5 steps

Recommended textbooks for you
Holt Mcdougal Larson Pre-algebra: Student Edition…
Algebra
ISBN:
9780547587776
Author:
HOLT MCDOUGAL
Publisher:
HOLT MCDOUGAL

College Algebra (MindTap Course List)
Algebra
ISBN:
9781305652231
Author:
R. David Gustafson, Jeff Hughes
Publisher:
Cengage Learning

Glencoe Algebra 1, Student Edition, 9780079039897…
Algebra
ISBN:
9780079039897
Author:
Carter
Publisher:
McGraw Hill
Holt Mcdougal Larson Pre-algebra: Student Edition…
Algebra
ISBN:
9780547587776
Author:
HOLT MCDOUGAL
Publisher:
HOLT MCDOUGAL
College Algebra (MindTap Course List)
Algebra
ISBN:
9781305652231
Author:
R. David Gustafson, Jeff Hughes
Publisher:
Cengage Learning
Glencoe Algebra 1, Student Edition, 9780079039897…
Algebra
ISBN:
9780079039897
Author:
Carter
Publisher:
McGraw Hill
