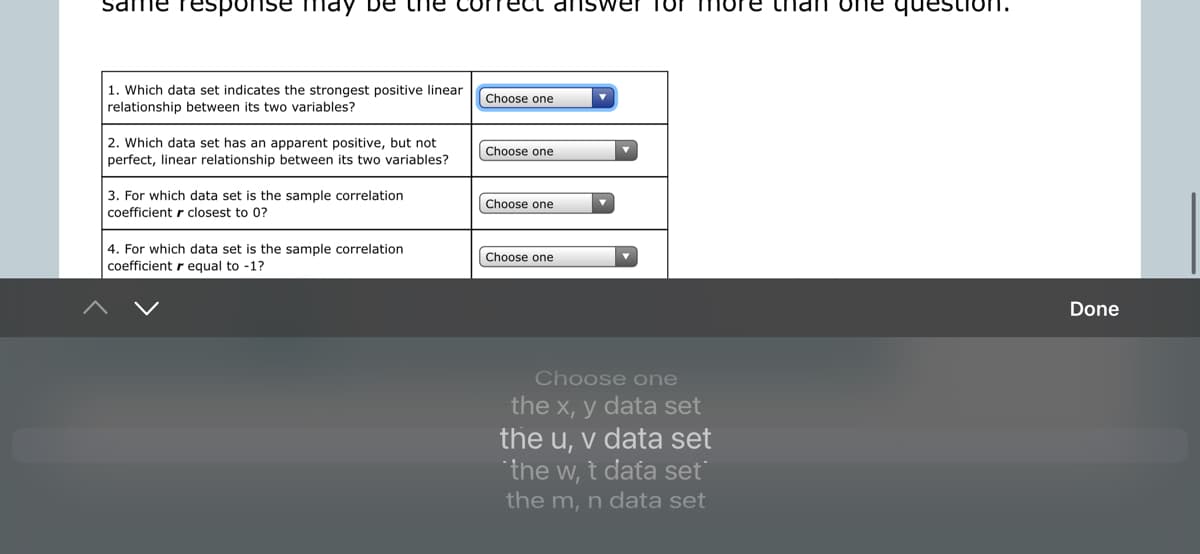
1. Which data set indicates the strongest positive linear relationship between its two variables? Choose one 2. Which data set has an apparent positive, but not perfect, linear relationship between its two variables? Choose one 3. For which data set is the sample correlation coefficient r closest to 0? Choose one 4. For which data set is the sample correlation

Glencoe Algebra 1, Student Edition, 9780079039897, 0079039898, 2018
18th Edition
ISBN:9780079039897
Author:Carter
Publisher:Carter
Chapter4: Equations Of Linear Functions
Section4.5: Correlation And Causation
Problem 24PFA
icon
Related questions
icon
Concept explainers
Question
Same response flay be tile Cumecl diswer
re than one questio
1. Which data set indicates the strongest positive linear
relationship between its two variables?
Choose one
2. Which data set has an apparent positive, but not
perfect, linear relationship between its two variables?
Choose one
3. For which data set is the sample correlation
Choose one
coefficient r closest to 0?
4. For which data set is the sample correlation
coefficient r equal to -1?
Choose one
Done
Choose one
the x, y data set
the u, v data set
"the w, t data set
the m, n data set
Transcribed Image Text:Same response flay be tile Cumecl diswer re than one questio 1. Which data set indicates the strongest positive linear relationship between its two variables? Choose one 2. Which data set has an apparent positive, but not perfect, linear relationship between its two variables? Choose one 3. For which data set is the sample correlation Choose one coefficient r closest to 0? 4. For which data set is the sample correlation coefficient r equal to -1? Choose one Done Choose one the x, y data set the u, v data set "the w, t data set the m, n data set
10:23
AA
www-awn.aleks.com
O REGRESSION AND CORRELATION
Linear relationship and the sample.
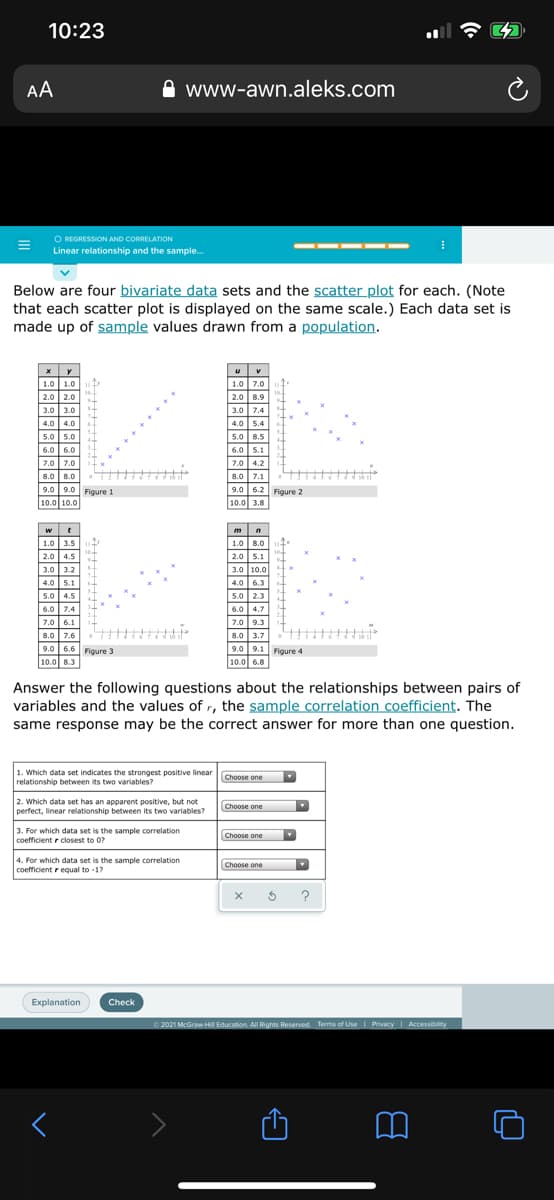
Below are four bivariate data sets and the scatter plot for each. (Note
that each scatter plot is displayed on the same scale.) Each data set is
made up of sample values drawn from a population.
1.0 1.0
1.0 7.0
2.0 2.0
2.0 8.9
3.0 3.0
3.0 7.4
4.0 4.0
4.0 5.4
5.0 5.0
5.0 | 8.5
6.0 | 6.0
6.0 | 5.1
7.0| 7.0
7.0 4.2
8.0 8.0
8.0 7.1
9.0 9.0 Figure 1
9.0 6.2 Figure 2
10.0 10.0
10.0 3.8
w
m
1.0| 3.5
1.0 8.0
2.0 4.5
2.0 5.1
3.0 3.2
3.0 10.0
4.0 5.1
4.0 6.3
5.0 4.5
5.0 2.3
6.0 7.4
6.0 4,7
7.0 6.1
7.0 9.3
7.6
9.0 6.6 Figure 3
10.0 8.3
8.0 7.6
8.0 3.7
9.0 9.1 Figure 4
10.0 6.8
Answer the following questions about the relationships between pairs of
variables and the values of r, the sample correlation coefficient. The
same response may be the correct answer for more than one question.
1. Which data set indicates the strongest positive linear
relationship between its two variables?
Choose one
2. Which data set has an apparent positive, but not
perfect, linear relationship between its two variables?
Choose one
3. For which data set is the sample correlation
Choose one
coefficient r closest to 0?
4. For which data set is the sample correlation
coefficient r equal to -17
Choose one
?
Explanation
Check
O 2021 McGraw-Hil Education. All Rights Reserved. Terms of Use
I
Privacy Accessiblity
Transcribed Image Text:10:23 AA www-awn.aleks.com O REGRESSION AND CORRELATION Linear relationship and the sample. Below are four bivariate data sets and the scatter plot for each. (Note that each scatter plot is displayed on the same scale.) Each data set is made up of sample values drawn from a population. 1.0 1.0 1.0 7.0 2.0 2.0 2.0 8.9 3.0 3.0 3.0 7.4 4.0 4.0 4.0 5.4 5.0 5.0 5.0 | 8.5 6.0 | 6.0 6.0 | 5.1 7.0| 7.0 7.0 4.2 8.0 8.0 8.0 7.1 9.0 9.0 Figure 1 9.0 6.2 Figure 2 10.0 10.0 10.0 3.8 w m 1.0| 3.5 1.0 8.0 2.0 4.5 2.0 5.1 3.0 3.2 3.0 10.0 4.0 5.1 4.0 6.3 5.0 4.5 5.0 2.3 6.0 7.4 6.0 4,7 7.0 6.1 7.0 9.3 7.6 9.0 6.6 Figure 3 10.0 8.3 8.0 7.6 8.0 3.7 9.0 9.1 Figure 4 10.0 6.8 Answer the following questions about the relationships between pairs of variables and the values of r, the sample correlation coefficient. The same response may be the correct answer for more than one question. 1. Which data set indicates the strongest positive linear relationship between its two variables? Choose one 2. Which data set has an apparent positive, but not perfect, linear relationship between its two variables? Choose one 3. For which data set is the sample correlation Choose one coefficient r closest to 0? 4. For which data set is the sample correlation coefficient r equal to -17 Choose one ? Explanation Check O 2021 McGraw-Hil Education. All Rights Reserved. Terms of Use I Privacy Accessiblity
Expert Solution
trending now

Trending now

This is a popular solution!

steps

Step by step

Solved in 5 steps

Blurred answer
Knowledge Booster
Correlation, Regression, and Association
Learn more about
Need a deep-dive on the concept behind this application? Look no further. Learn more about this topic, statistics and related others by exploring similar questions and additional content below.
Recommended textbooks for you
Glencoe Algebra 1, Student Edition, 9780079039897…
Algebra
ISBN:
9780079039897
Author:
Carter
Publisher:
McGraw Hill