1. Which engine do you prefer according to the table above? Why? 2. Construct and interpret a 95% confidence interval for the difference of two population means. 3. Does the data indicate that the effectiveness of Engine A is same as Engine B? Test at 5% level of significance. 4. Is your result in confidence interval consistent with your result in hypothesis testing? State the reason.
1. Which engine do you prefer according to the table above? Why? 2. Construct and interpret a 95% confidence interval for the difference of two population means. 3. Does the data indicate that the effectiveness of Engine A is same as Engine B? Test at 5% level of significance. 4. Is your result in confidence interval consistent with your result in hypothesis testing? State the reason.

MATLAB: An Introduction with Applications
6th Edition
ISBN:9781119256830
Author:Amos Gilat
Publisher:Amos Gilat
Chapter1: Starting With Matlab
Section: Chapter Questions
Problem 1P

Related questions
Question
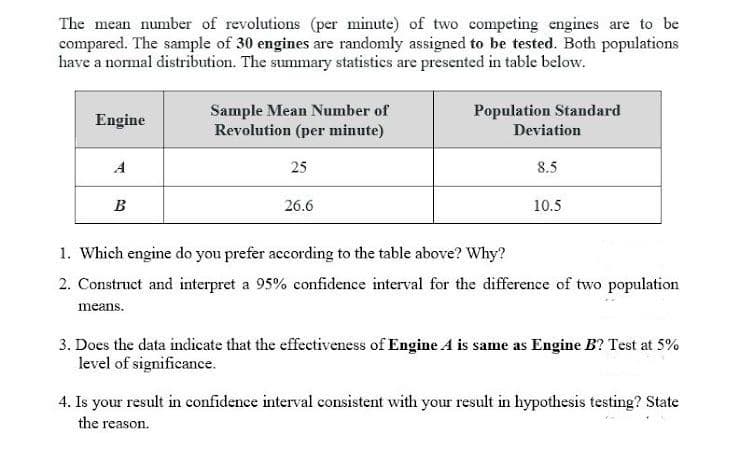
Transcribed Image Text:The mean number of revolutions (per minute) of two competing engines are to be
compared. The sample of 30 engines are randomly assigned to be tested. Both populations
have a normal distribution. The summary statistics are presented in table below.
Sample Mean Number of
Revolution (per minute)
Population Standard
Engine
Deviation
A
25
8.5
B
26.6
10.5
1. Which engine do you prefer according to the table above? Why?
2. Construct and interpret a 95% confidence interval for the difference of two population
means.
3. Does the data indicate that the effectiveness of Engine A is same as Engine B? Test at 5%
level of significance.
4. Is your result in confidence interval consistent with your result in hypothesis testing? State
the reason.
Expert Solution
This question has been solved!
Explore an expertly crafted, step-by-step solution for a thorough understanding of key concepts.

Step by step
Solved in 5 steps with 5 images

Recommended textbooks for you
MATLAB: An Introduction with Applications
Statistics
ISBN:
9781119256830
Author:
Amos Gilat
Publisher:
John Wiley & Sons Inc

Probability and Statistics for Engineering and th…
Statistics
ISBN:
9781305251809
Author:
Jay L. Devore
Publisher:
Cengage Learning

Statistics for The Behavioral Sciences (MindTap C…
Statistics
ISBN:
9781305504912
Author:
Frederick J Gravetter, Larry B. Wallnau
Publisher:
Cengage Learning
MATLAB: An Introduction with Applications
Statistics
ISBN:
9781119256830
Author:
Amos Gilat
Publisher:
John Wiley & Sons Inc
Probability and Statistics for Engineering and th…
Statistics
ISBN:
9781305251809
Author:
Jay L. Devore
Publisher:
Cengage Learning
Statistics for The Behavioral Sciences (MindTap C…
Statistics
ISBN:
9781305504912
Author:
Frederick J Gravetter, Larry B. Wallnau
Publisher:
Cengage Learning

Elementary Statistics: Picturing the World (7th E…
Statistics
ISBN:
9780134683416
Author:
Ron Larson, Betsy Farber
Publisher:
PEARSON

The Basic Practice of Statistics
Statistics
ISBN:
9781319042578
Author:
David S. Moore, William I. Notz, Michael A. Fligner
Publisher:
W. H. Freeman

Introduction to the Practice of Statistics
Statistics
ISBN:
9781319013387
Author:
David S. Moore, George P. McCabe, Bruce A. Craig
Publisher:
W. H. Freeman