1. Your graph should have two "peaks." At the highest of the two, what wavelength was most strongly absorbed by the chloroplast pigments? What wavelength corresponds the top of the second peak? What wavelength was least absorbed by the chloroplast pigments? 2. Based on your observations, which wavelength (color) of light might be expected to generate the lowest rate of photosynthesis?
1. Your graph should have two "peaks." At the highest of the two, what wavelength was most strongly absorbed by the chloroplast pigments? What wavelength corresponds the top of the second peak? What wavelength was least absorbed by the chloroplast pigments? 2. Based on your observations, which wavelength (color) of light might be expected to generate the lowest rate of photosynthesis?

Biology 2e
2nd Edition
ISBN:9781947172517
Author:Matthew Douglas, Jung Choi, Mary Ann Clark
Publisher:Matthew Douglas, Jung Choi, Mary Ann Clark
Chapter8: Photosynthesis
Section: Chapter Questions
Problem 15RQ: Plants containing only chlorophyll b are exposed to radiation with the following wavelengths: 10nm...

Related questions

Question
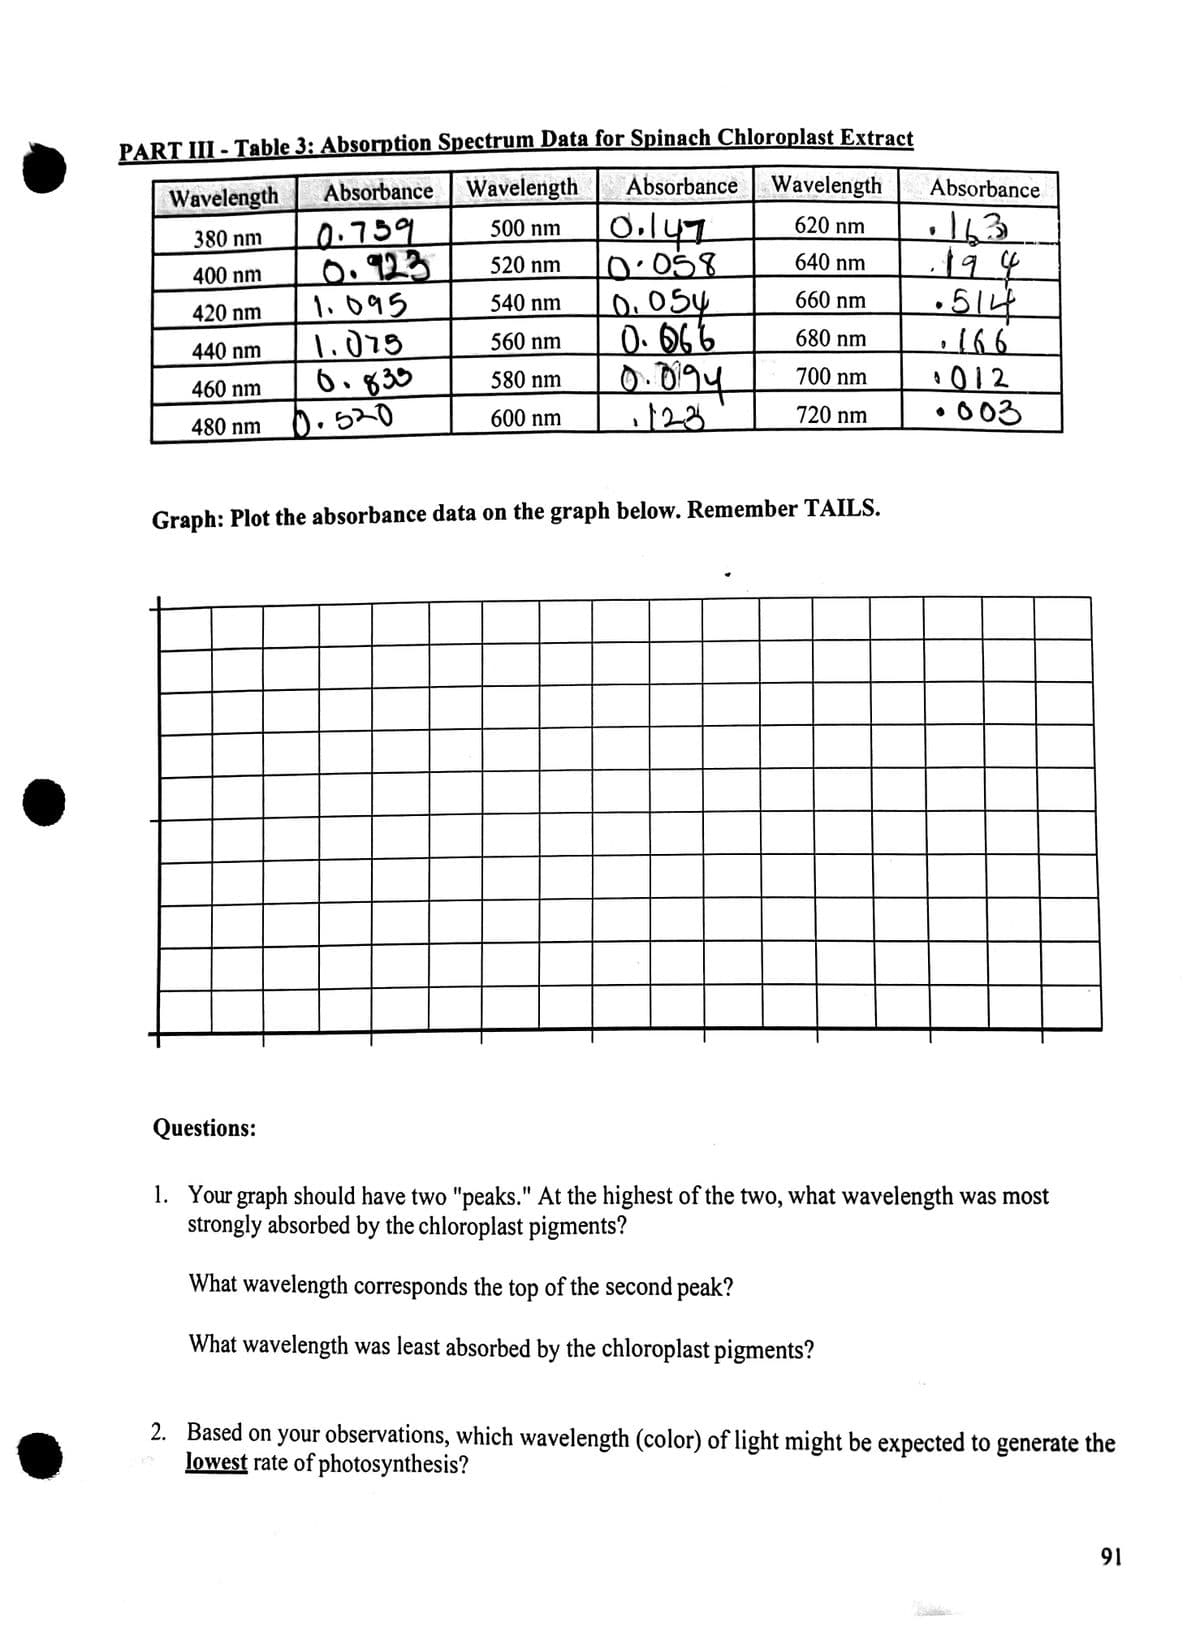
Transcribed Image Text:PART III - Table 3: Absorption Spectrum Data for Spinach Chloroplast Extract
Absorbance Wavelength
620 nm
0.147
640 nm
0.058
660 nm
680 nm
700 nm
720 nm
Wavelength
380 nm
400 nm
420 nm
440 nm
460 nm
480 nm
Absorbance
0.759
0.923
Questions:
1.095
1.075
0.833
10.520
Wavelength
500 nm
520 nm
540 nm
560 nm
580 nm
600 nm
0.054
0.066
0.094
123
Graph: Plot the absorbance data on the graph below. Remember TAILS.
Absorbance
·
163
·19 4
•514
· 166
1012
·003
1. Your graph should have two "peaks." At the highest of the two, what wavelength was most
strongly absorbed by the chloroplast pigments?
What wavelength corresponds the top of the second peak?
What wavelength was least absorbed by the chloroplast pigments?
2. Based on your observations, which wavelength (color) of light might be expected to generate the
lowest rate of photosynthesis?
91
Expert Solution
This question has been solved!
Explore an expertly crafted, step-by-step solution for a thorough understanding of key concepts.

This is a popular solution!

Trending now
This is a popular solution!

Step by step
Solved in 2 steps with 1 images

Knowledge Booster


Learn more about
Need a deep-dive on the concept behind this application? Look no further. Learn more about this topic, biology and related others by exploring similar questions and additional content below.Recommended textbooks for you
Biology 2e
Biology
ISBN:
9781947172517
Author:
Matthew Douglas, Jung Choi, Mary Ann Clark
Publisher:
OpenStax

Biology: The Dynamic Science (MindTap Course List)
Biology
ISBN:
9781305389892
Author:
Peter J. Russell, Paul E. Hertz, Beverly McMillan
Publisher:
Cengage Learning
Biology 2e
Biology
ISBN:
9781947172517
Author:
Matthew Douglas, Jung Choi, Mary Ann Clark
Publisher:
OpenStax
Biology: The Dynamic Science (MindTap Course List)
Biology
ISBN:
9781305389892
Author:
Peter J. Russell, Paul E. Hertz, Beverly McMillan
Publisher:
Cengage Learning