What is shown in the graph? A) B) C) D) 40,000 Population 0 exponential decay of a population exponential growth of a population arithmetic progression of a population an inverse relation between time and population Time 10 hr
What is shown in the graph? A) B) C) D) 40,000 Population 0 exponential decay of a population exponential growth of a population arithmetic progression of a population an inverse relation between time and population Time 10 hr

Biology (MindTap Course List)
11th Edition
ISBN:9781337392938
Author:Eldra Solomon, Charles Martin, Diana W. Martin, Linda R. Berg
Publisher:Eldra Solomon, Charles Martin, Diana W. Martin, Linda R. Berg
Chapter53: Introduction To Ecology: Population Ecology
Section: Chapter Questions
Problem 5TYU: In a graph of population size versus time, a J-shaped curve is characteristic of (a) exponential...

Related questions

Question
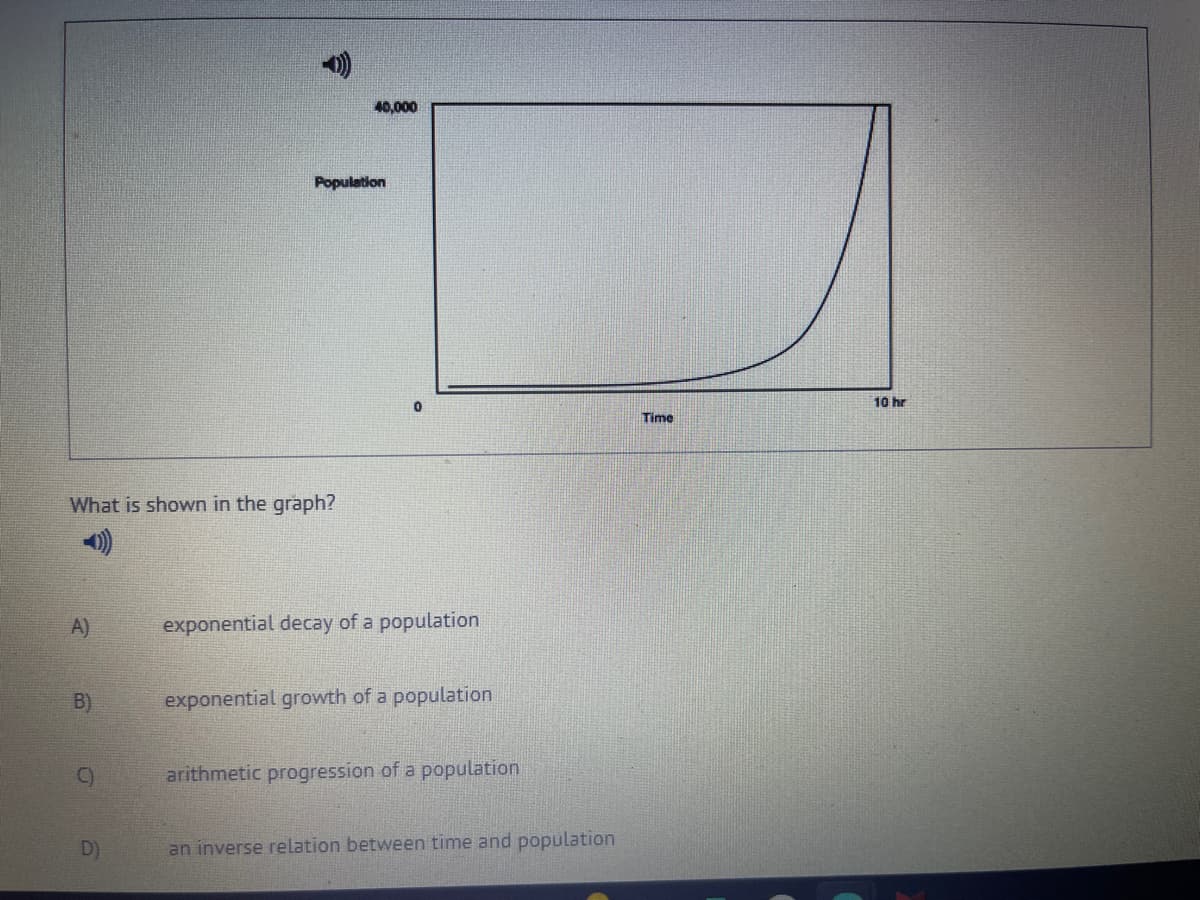
Transcribed Image Text:What is shown in the graph?
A)
B)
()
D)
40,000
Population
0
exponential decay of a population
exponential growth of a population
arithmetic progression of a population
an inverse relation between time and population
Time
10 hr
Expert Solution
This question has been solved!
Explore an expertly crafted, step-by-step solution for a thorough understanding of key concepts.

This is a popular solution!

Trending now
This is a popular solution!

Step by step
Solved in 2 steps

Knowledge Booster


Learn more about
Need a deep-dive on the concept behind this application? Look no further. Learn more about this topic, biology and related others by exploring similar questions and additional content below.Recommended textbooks for you
Biology (MindTap Course List)
Biology
ISBN:
9781337392938
Author:
Eldra Solomon, Charles Martin, Diana W. Martin, Linda R. Berg
Publisher:
Cengage Learning

Case Studies In Health Information Management
Biology
ISBN:
9781337676908
Author:
SCHNERING
Publisher:
Cengage
Biology (MindTap Course List)
Biology
ISBN:
9781337392938
Author:
Eldra Solomon, Charles Martin, Diana W. Martin, Linda R. Berg
Publisher:
Cengage Learning
Case Studies In Health Information Management
Biology
ISBN:
9781337676908
Author:
SCHNERING
Publisher:
Cengage