10) An insurance company want to know how the amounts of life insurance depend on the incomes of persons. The research department at a company collected information on six persons. The following table lists the annual incomes (in thousands of dollars) and amounts of life insurance policies (in thousands of dollars) for these six persons. Annual Life Income Insurance 62 250 78 300 41 100 53 150 85 500 34 75 a) Calculate the estimated simple regression model. Show all handwritten steps. b) Give a proper interpretation of the slope in this set of data. c) For someone with an annual income of $53,000, find the predicted amount of life insurance. d) What is the residual associated with a person with an annual income of $53,000? e) For someone with an annual income of $100,000, find is the predicted amount of life insurance. Is this any potential issues with this prediction? Explain! f) The following ANOVA table was calculated for this problem. Calculate the coefficient of determination r. Analysis of variance table for regression model: Source DF MS F-stat P-value 1 112336.08 112336.08 34.080594 0.0043 Model Error 4 13184.756 3296.189 Total 5 125520.83 For Problems 2): Suppose the following data were obtained from UA students: • Number of caffeinated beverages consumed per week • Dominant Eye: Left, Right GPA in non-general studies courses • GPA in general studies courses Favoritetype of music: Rock, Hip-hop, Country, Other Eye you wink with - left or right College: Arts & Sciences, Health, Education, Engineering, Business Consider the statistical inference procedures we've studied: One-sample proportion test and CI, One-sample t-test and CI, Paired t-test and Cl. Two-samplet-test and CI, Chi-square test, Correlation test/ Regression slope test, ANOVA F-test. For each of the following problems: • Identify the appropriate inferential procedure for addressing each of the following research questions based on the variables listed above. For hypothesis tests, state the null and alternative hypotheses. For intervals, identify the symbol of the parameter that is being estimated and provide the confidence interval that would be used. a. Do students who are left-eye winkers have higher GPA's in general studies courses, on average, than those whowinkwiththeir right eye? b. Is there a link between one's dominant eye and the eye one winks with? c. What is the average GPA in Gen Ed courses for students whose favorite type of music is Country? d. Isthere a relationship between the student's college and favorite type of music? e. Do most students wink with their right eye? f. Does the average amount of caffeine consumed differ among the five colleges? g. What percent of UA students prefer country music? h. Dostudents tend to have higher GPA's in their Gen Ed courses than in their other courses? i. Is the true averagenumber of caffeinated beverages per week a college student drinks per week greater than Page 2 I 7
10) An insurance company want to know how the amounts of life insurance depend on the incomes of persons. The research department at a company collected information on six persons. The following table lists the annual incomes (in thousands of dollars) and amounts of life insurance policies (in thousands of dollars) for these six persons. Annual Life Income Insurance 62 250 78 300 41 100 53 150 85 500 34 75 a) Calculate the estimated simple regression model. Show all handwritten steps. b) Give a proper interpretation of the slope in this set of data. c) For someone with an annual income of $53,000, find the predicted amount of life insurance. d) What is the residual associated with a person with an annual income of $53,000? e) For someone with an annual income of $100,000, find is the predicted amount of life insurance. Is this any potential issues with this prediction? Explain! f) The following ANOVA table was calculated for this problem. Calculate the coefficient of determination r. Analysis of variance table for regression model: Source DF MS F-stat P-value 1 112336.08 112336.08 34.080594 0.0043 Model Error 4 13184.756 3296.189 Total 5 125520.83 For Problems 2): Suppose the following data were obtained from UA students: • Number of caffeinated beverages consumed per week • Dominant Eye: Left, Right GPA in non-general studies courses • GPA in general studies courses Favoritetype of music: Rock, Hip-hop, Country, Other Eye you wink with - left or right College: Arts & Sciences, Health, Education, Engineering, Business Consider the statistical inference procedures we've studied: One-sample proportion test and CI, One-sample t-test and CI, Paired t-test and Cl. Two-samplet-test and CI, Chi-square test, Correlation test/ Regression slope test, ANOVA F-test. For each of the following problems: • Identify the appropriate inferential procedure for addressing each of the following research questions based on the variables listed above. For hypothesis tests, state the null and alternative hypotheses. For intervals, identify the symbol of the parameter that is being estimated and provide the confidence interval that would be used. a. Do students who are left-eye winkers have higher GPA's in general studies courses, on average, than those whowinkwiththeir right eye? b. Is there a link between one's dominant eye and the eye one winks with? c. What is the average GPA in Gen Ed courses for students whose favorite type of music is Country? d. Isthere a relationship between the student's college and favorite type of music? e. Do most students wink with their right eye? f. Does the average amount of caffeine consumed differ among the five colleges? g. What percent of UA students prefer country music? h. Dostudents tend to have higher GPA's in their Gen Ed courses than in their other courses? i. Is the true averagenumber of caffeinated beverages per week a college student drinks per week greater than Page 2 I 7

College Algebra
7th Edition
ISBN:9781305115545
Author:James Stewart, Lothar Redlin, Saleem Watson
Publisher:James Stewart, Lothar Redlin, Saleem Watson
Chapter1: Equations And Graphs
Section: Chapter Questions
Problem 10T: Olympic Pole Vault The graph in Figure 7 indicates that in recent years the winning Olympic men’s...

Related questions
Question
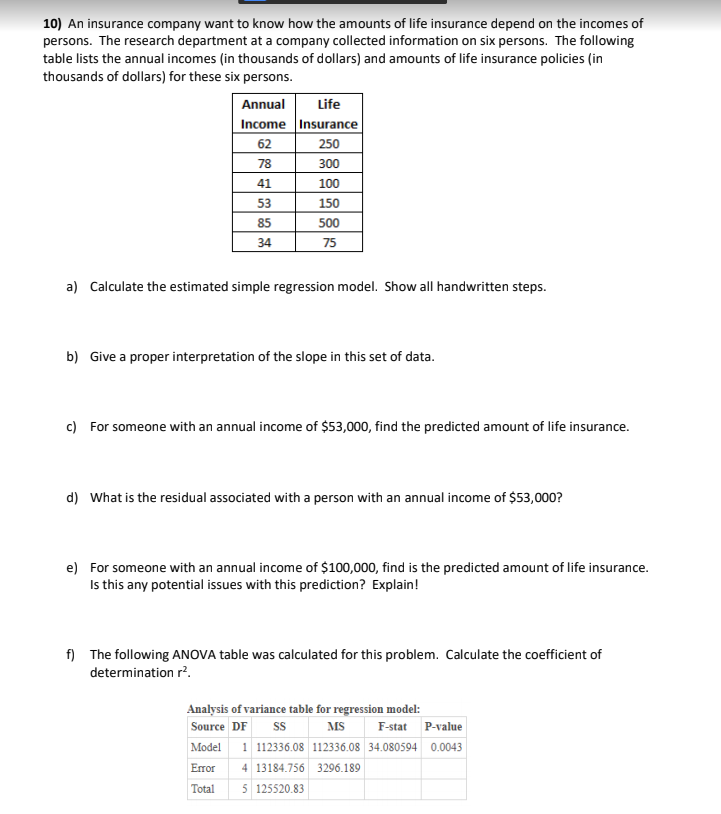
Transcribed Image Text:10) An insurance company want to know how the amounts of life insurance depend on the incomes of
persons. The research department at a company collected information on six persons. The following
table lists the annual incomes (in thousands of dollars) and amounts of life insurance policies (in
thousands of dollars) for these six persons.
Annual
Life
Income Insurance
62
250
78
300
41
100
53
150
85
500
34
75
a) Calculate the estimated simple regression model. Show all handwritten steps.
b) Give a proper interpretation of the slope in this set of data.
c) For someone with an annual income of $53,000, find the predicted amount of life insurance.
d) What is the residual associated with a person with an annual income of $53,000?
e) For someone with an annual income of $100,000, find is the predicted amount of life insurance.
Is this any potential issues with this prediction? Explain!
f) The following ANOVA table was calculated for this problem. Calculate the coefficient of
determination r.
Analysis of variance table for regression model:
Source DF
MS
F-stat P-value
1 112336.08 112336.08 34.080594 0.0043
Model
Error
4 13184.756 3296.189
Total
5 125520.83
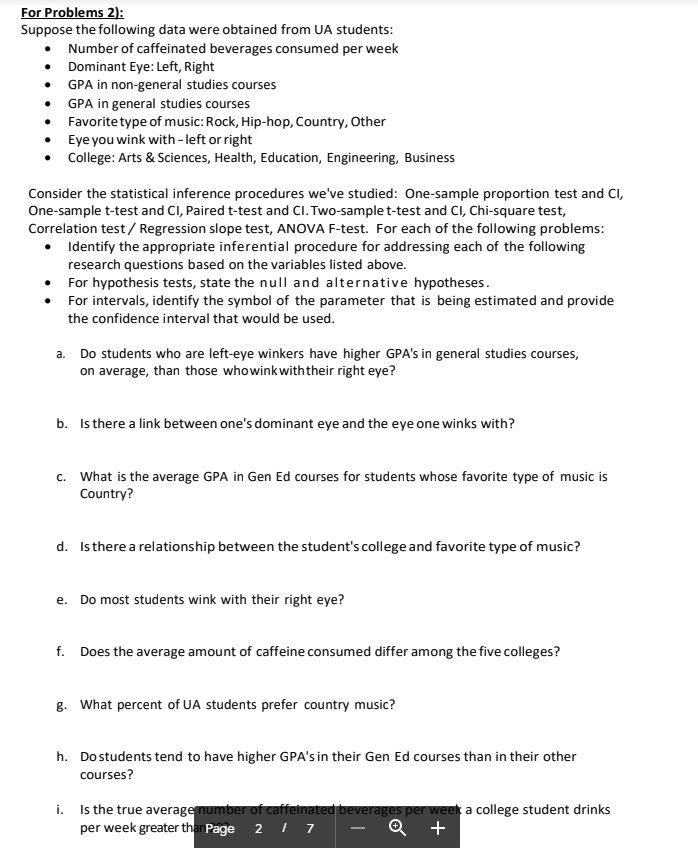
Transcribed Image Text:For Problems 2):
Suppose the following data were obtained from UA students:
• Number of caffeinated beverages consumed per week
• Dominant Eye: Left, Right
GPA in non-general studies courses
• GPA in general studies courses
Favoritetype of music: Rock, Hip-hop, Country, Other
Eye you wink with - left or right
College: Arts & Sciences, Health, Education, Engineering, Business
Consider the statistical inference procedures we've studied: One-sample proportion test and CI,
One-sample t-test and CI, Paired t-test and Cl. Two-samplet-test and CI, Chi-square test,
Correlation test/ Regression slope test, ANOVA F-test. For each of the following problems:
• Identify the appropriate inferential procedure for addressing each of the following
research questions based on the variables listed above.
For hypothesis tests, state the null and alternative hypotheses.
For intervals, identify the symbol of the parameter that is being estimated and provide
the confidence interval that would be used.
a. Do students who are left-eye winkers have higher GPA's in general studies courses,
on average, than those whowinkwiththeir right eye?
b. Is there a link between one's dominant eye and the eye one winks with?
c. What is the average GPA in Gen Ed courses for students whose favorite type of music is
Country?
d. Isthere a relationship between the student's college and favorite type of music?
e. Do most students wink with their right eye?
f. Does the average amount of caffeine consumed differ among the five colleges?
g. What percent of UA students prefer country music?
h. Dostudents tend to have higher GPA's in their Gen Ed courses than in their other
courses?
i.
Is the true averagenumber of caffeinated beverages per week a college student drinks
per week greater than Page 2 I 7
Expert Solution
This question has been solved!
Explore an expertly crafted, step-by-step solution for a thorough understanding of key concepts.

This is a popular solution!

Trending now
This is a popular solution!

Step by step
Solved in 3 steps with 5 images

Recommended textbooks for you
College Algebra
Algebra
ISBN:
9781305115545
Author:
James Stewart, Lothar Redlin, Saleem Watson
Publisher:
Cengage Learning

Linear Algebra: A Modern Introduction
Algebra
ISBN:
9781285463247
Author:
David Poole
Publisher:
Cengage Learning
College Algebra
Algebra
ISBN:
9781305115545
Author:
James Stewart, Lothar Redlin, Saleem Watson
Publisher:
Cengage Learning
Linear Algebra: A Modern Introduction
Algebra
ISBN:
9781285463247
Author:
David Poole
Publisher:
Cengage Learning