The questions below are based on a dataset containing the characteristics of 5,407 households. In particular, we will use the following variables: - size: home size, measured in square feet. - hhinc: annual household net income, measured in euros. - owner: dummy variable equal to 1 if the living space is owned, and 0 if the living space is rented. - hhsize1: dummy variable equal to 1 if the number of household’s members is 1 or 2, and 0 otherwise. - hhsize2: dummy variable equal to 1 if the number of household’s members is 3 or 4, and 0 otherwise. - hhsize3: dummy variable equal to 1 if the number of household’s members is 5 or above 5, and 0 otherwise. - edu: education level of household’s members. We conduct a simple regression of size on hhinc, now using robust standard errors. The regression output is reported in Table 2. Why are the estimated coefficients in Table 2 equal to the estimated coefficients in Table 1? Do the conclusions on the statistical significance at 5% of the coefficient of hhinc change between Tables 1 and 2?


The questions below are based on a dataset containing the characteristics of 5,407
households. In particular, we will use the following variables:
- size: home size, measured in square feet.
- hhinc: annual household net income, measured in euros.
- owner: dummy variable equal to 1 if the living space is owned, and 0 if the living
space is rented.
- hhsize1: dummy variable equal to 1 if the number of household’s members is 1 or
2, and 0 otherwise.
- hhsize2: dummy variable equal to 1 if the number of household’s members is 3 or
4, and 0 otherwise.
- hhsize3: dummy variable equal to 1 if the number of household’s members is 5 or
above 5, and 0 otherwise.
- edu: education level of household’s members.
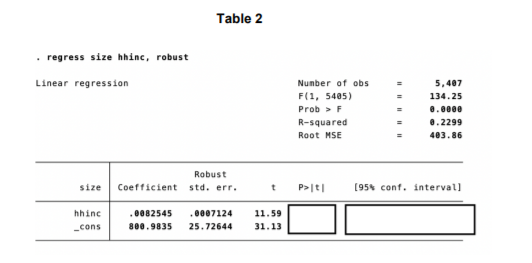
We conduct a simple regression of size on hhinc, now using robust standard errors.
The regression output is reported in Table 2. Why are the estimated coefficients in
Table 2 equal to the estimated coefficients in Table 1? Do the conclusions on the
statistical significance at 5% of the coefficient of hhinc change between Tables 1 and
2?
![Table 1
• regress size hhinc
Source
df
MS
Number of obs
5,407
F(1, 5405)
1613.34
1 263141566
Model
263141566
Prob > F
0.0000
Residual
R-squared
Adj R-squared
Total
1.1447e+09
5,406 211749.457
Root MSE
size
Coefficient
Std. err.
t
P>|t|
[95% conf. interval]
hhinc
.0082545
.0002055
40.17
0.000
.0078516
.0086574
-cons
800.9835
9.404917
85.17
0.000
782.5461
819.4209](/v2/_next/image?url=https%3A%2F%2Fcontent.bartleby.com%2Fqna-images%2Fquestion%2F9a398711-6bb1-446b-9b69-373cfacdd600%2Ffde6101c-2d47-46ad-a05a-267fe85bb4e7%2F6mhspro_processed.png&w=3840&q=75)

Step by step
Solved in 3 steps


