10. The following graph shows the marginal and average product curves for labor, the firm's only variable input. The monthly wage for labor is $2,000. Fixed cost is $120,000.
10. The following graph shows the marginal and average product curves for labor, the firm's only variable input. The monthly wage for labor is $2,000. Fixed cost is $120,000.

Chapter7: Production And Cost In The Firm
Section: Chapter Questions
Problem 3.7P

Related questions
Question
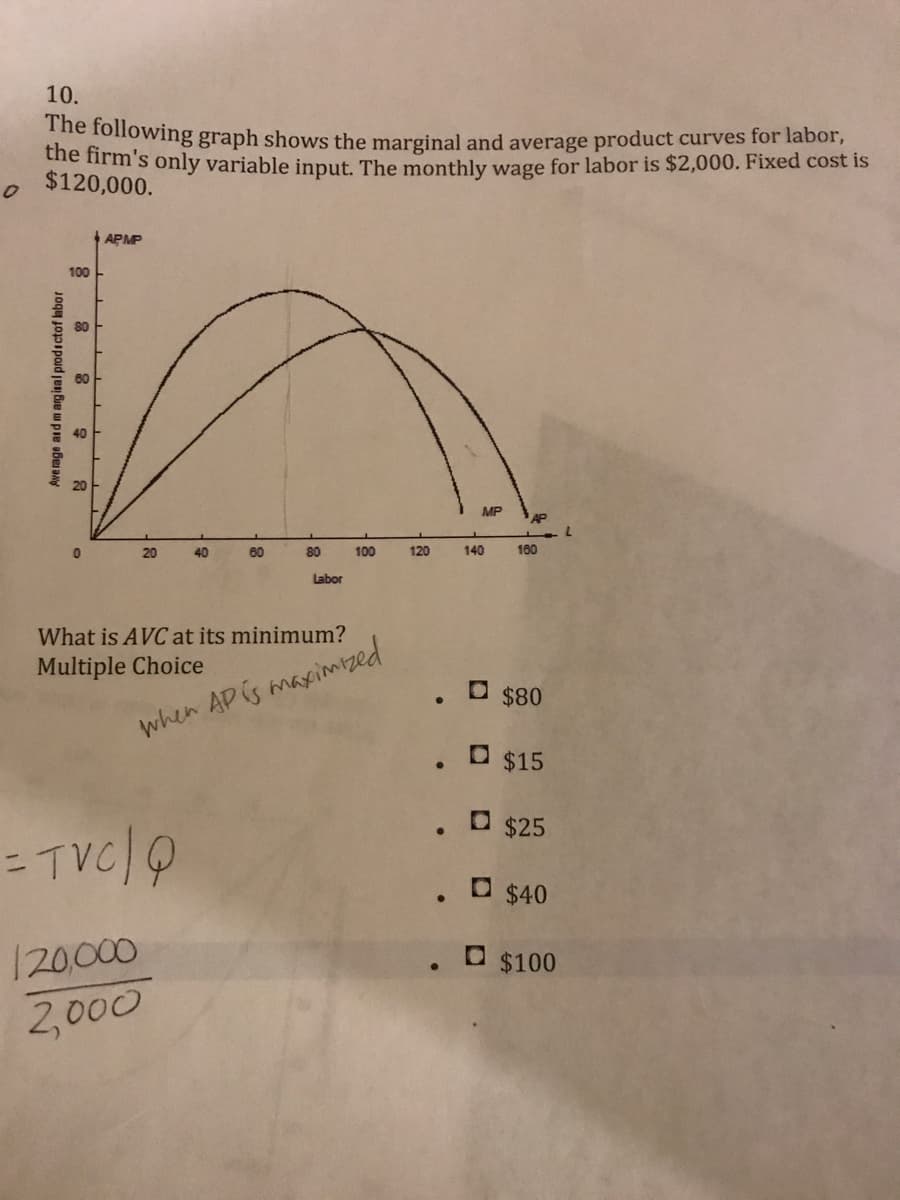
Transcribed Image Text:10.
the olowing graph shows the marginal and average product curves for labor,
the firm's only variable input. The monthly wage for labor is $2,000. Fixed cost is
$120,000.
+ APMP
100
80
60
MP
AP
20
40
60
80
100
120
140
10
Labor
What is AVC at its minimum?
Multiple Choice
O $80
when AP is maximzed
O $15
. O$25
.O$40
120000
. O$100
2,000
Ave rage ard m arginal prodictof labor
Expert Solution
This question has been solved!
Explore an expertly crafted, step-by-step solution for a thorough understanding of key concepts.

This is a popular solution!

Trending now
This is a popular solution!

Step by step
Solved in 2 steps

Knowledge Booster


Learn more about
Need a deep-dive on the concept behind this application? Look no further. Learn more about this topic, economics and related others by exploring similar questions and additional content below.Recommended textbooks for you


Principles of Economics 2e
Economics
ISBN:
9781947172364
Author:
Steven A. Greenlaw; David Shapiro
Publisher:
OpenStax
Principles of Economics 2e
Economics
ISBN:
9781947172364
Author:
Steven A. Greenlaw; David Shapiro
Publisher:
OpenStax

Principles of Economics, 7th Edition (MindTap Cou…
Economics
ISBN:
9781285165875
Author:
N. Gregory Mankiw
Publisher:
Cengage Learning

Principles of Microeconomics (MindTap Course List)
Economics
ISBN:
9781305971493
Author:
N. Gregory Mankiw
Publisher:
Cengage Learning

Principles of Economics (MindTap Course List)
Economics
ISBN:
9781305585126
Author:
N. Gregory Mankiw
Publisher:
Cengage Learning