The following graph shows the marginal and average product curves for labor, the firm's only variable input. The monthly wage for labor is $2,800. Fixed cost is $160,000. AAP, MP 20 MP AP L 20 40 60 100 120 140 160 80 Labor When the firm uses 120 units of labor, what is its marginal cost at this output? 100 Average and marginal product of labor
The following graph shows the marginal and average product curves for labor, the firm's only variable input. The monthly wage for labor is $2,800. Fixed cost is $160,000. AAP, MP 20 MP AP L 20 40 60 100 120 140 160 80 Labor When the firm uses 120 units of labor, what is its marginal cost at this output? 100 Average and marginal product of labor

Chapter7: Production And Cost In The Firm
Section: Chapter Questions
Problem 3.7P

Related questions

Question
The following graph shows the marginal and average product
When the firm uses 120 units of labor, what is its marginal cost at this output?
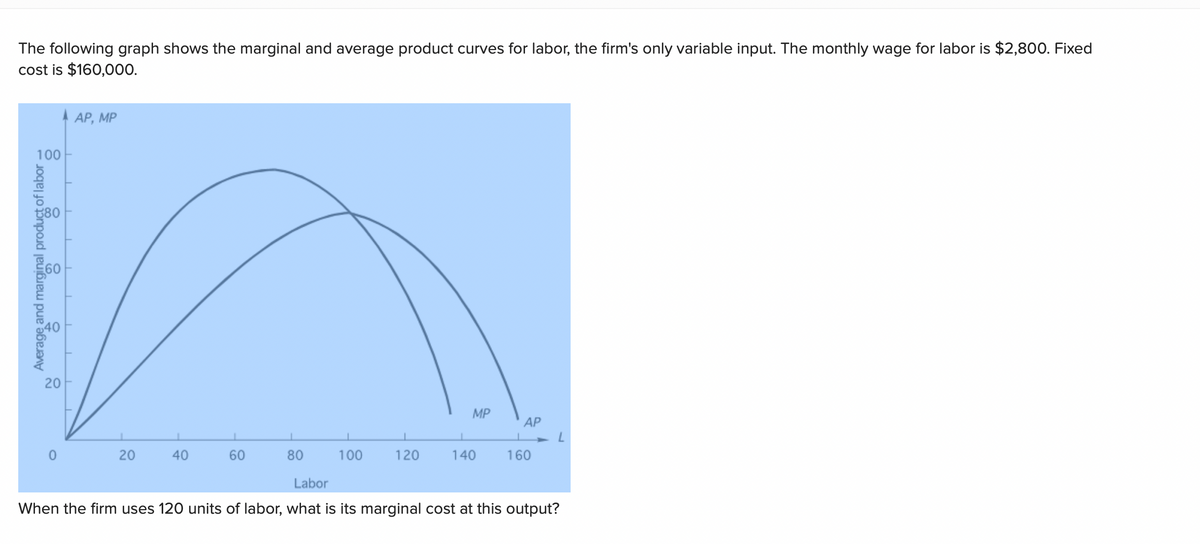
Transcribed Image Text:The following graph shows the marginal and average product curves for labor, the firm's only variable input. The monthly wage for labor is $2,800. Fixed
cost is $160,000.
AAP, MP
20
MP
AP
L
20
40
60
120
140
160
80 100
Labor
When the firm uses 120 units of labor, what is its marginal cost at this output?
100
product of lat
Average and marginal product of labor
Expert Solution
This question has been solved!
Explore an expertly crafted, step-by-step solution for a thorough understanding of key concepts.

This is a popular solution!

Trending now
This is a popular solution!

Step by step
Solved in 2 steps

Knowledge Booster


Learn more about
Need a deep-dive on the concept behind this application? Look no further. Learn more about this topic, economics and related others by exploring similar questions and additional content below.Recommended textbooks for you

Exploring Economics
Economics
ISBN:
9781544336329
Author:
Robert L. Sexton
Publisher:
SAGE Publications, Inc

Principles of Economics 2e
Economics
ISBN:
9781947172364
Author:
Steven A. Greenlaw; David Shapiro
Publisher:
OpenStax
Exploring Economics
Economics
ISBN:
9781544336329
Author:
Robert L. Sexton
Publisher:
SAGE Publications, Inc
Principles of Economics 2e
Economics
ISBN:
9781947172364
Author:
Steven A. Greenlaw; David Shapiro
Publisher:
OpenStax

Essentials of Economics (MindTap Course List)
Economics
ISBN:
9781337091992
Author:
N. Gregory Mankiw
Publisher:
Cengage Learning
