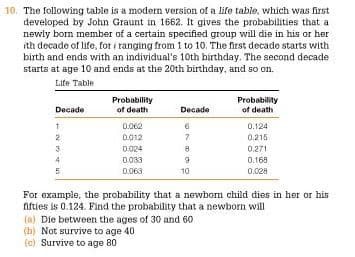
10. The following table is a modern version of a life table, which was first developed by John Graunt in 1662. It gives the probabilities that a newly born member of a certain specified group will die in his or her ith decade of life, for i tanging from 1 to 10. The first decade starts with birth and ends with an individual's 10th birthday. The second decade starts at age 10 and ends at the 20th birthday, and so on. Life Table Probability Probability of death Decade of death Decade 0.062 6 0.124 0.012 0.215 0.024 0.271 0.033 0.168 0.063 10 0.028 For example, the probability that a newborm child dies in her or his fifties is 0.124. Find the probability that a newborn will (a) Die between the ages of 30 and 60 (b) Not survive to age 40 (c) Survive to age 80
10. The following table is a modern version of a life table, which was first developed by John Graunt in 1662. It gives the probabilities that a newly born member of a certain specified group will die in his or her ith decade of life, for i tanging from 1 to 10. The first decade starts with birth and ends with an individual's 10th birthday. The second decade starts at age 10 and ends at the 20th birthday, and so on. Life Table Probability Probability of death Decade of death Decade 0.062 6 0.124 0.012 0.215 0.024 0.271 0.033 0.168 0.063 10 0.028 For example, the probability that a newborm child dies in her or his fifties is 0.124. Find the probability that a newborn will (a) Die between the ages of 30 and 60 (b) Not survive to age 40 (c) Survive to age 80

Chapter8: Sequences, Series,and Probability
Section8.7: Probability
Problem 11ECP: A manufacturer has determined that a machine averages one faulty unit for every 500 it produces....

Related questions

Concept explainers
Contingency Table
A contingency table can be defined as the visual representation of the relationship between two or more categorical variables that can be evaluated and registered. It is a categorical version of the scatterplot, which is used to investigate the linear relationship between two variables. A contingency table is indeed a type of frequency distribution table that displays two variables at the same time.
Binomial Distribution
Binomial is an algebraic expression of the sum or the difference of two terms. Before knowing about binomial distribution, we must know about the binomial theorem.
Topic Video
Question
Transcribed Image Text:10. The following table is a modern version of a life table, which was first
developed by John Graunt in 1662. It gives the probabilities that a
newly born member of a certain specified group will die in his or her
ith decade of life, for i ranging from 1 to 10. The first decade starts with
birth and ends with an individual's 10th birthday. The second decade
starts at age 10 and ends at the 20th birthday, and so on.
Life Table
Probability
Probability
of death
Decade
of death
Decade
0.062
0.124
0012
7
0.215
0.024
0.271
0033
0.169
0.063
10
0.028
For example, the probability that a newborn child dies in her or his
fifties is 0.124. Find the probability that a newborn will
(a) Die between the ages of 30 and 60
(b) Not survive to age 40
(c) Survive to age 80
Expert Solution
This question has been solved!
Explore an expertly crafted, step-by-step solution for a thorough understanding of key concepts.

This is a popular solution!

Trending now
This is a popular solution!

Step by step
Solved in 2 steps

Knowledge Booster


Learn more about
Need a deep-dive on the concept behind this application? Look no further. Learn more about this topic, statistics and related others by exploring similar questions and additional content below.Recommended textbooks for you

College Algebra
Algebra
ISBN:
9781305115545
Author:
James Stewart, Lothar Redlin, Saleem Watson
Publisher:
Cengage Learning
College Algebra
Algebra
ISBN:
9781305115545
Author:
James Stewart, Lothar Redlin, Saleem Watson
Publisher:
Cengage Learning