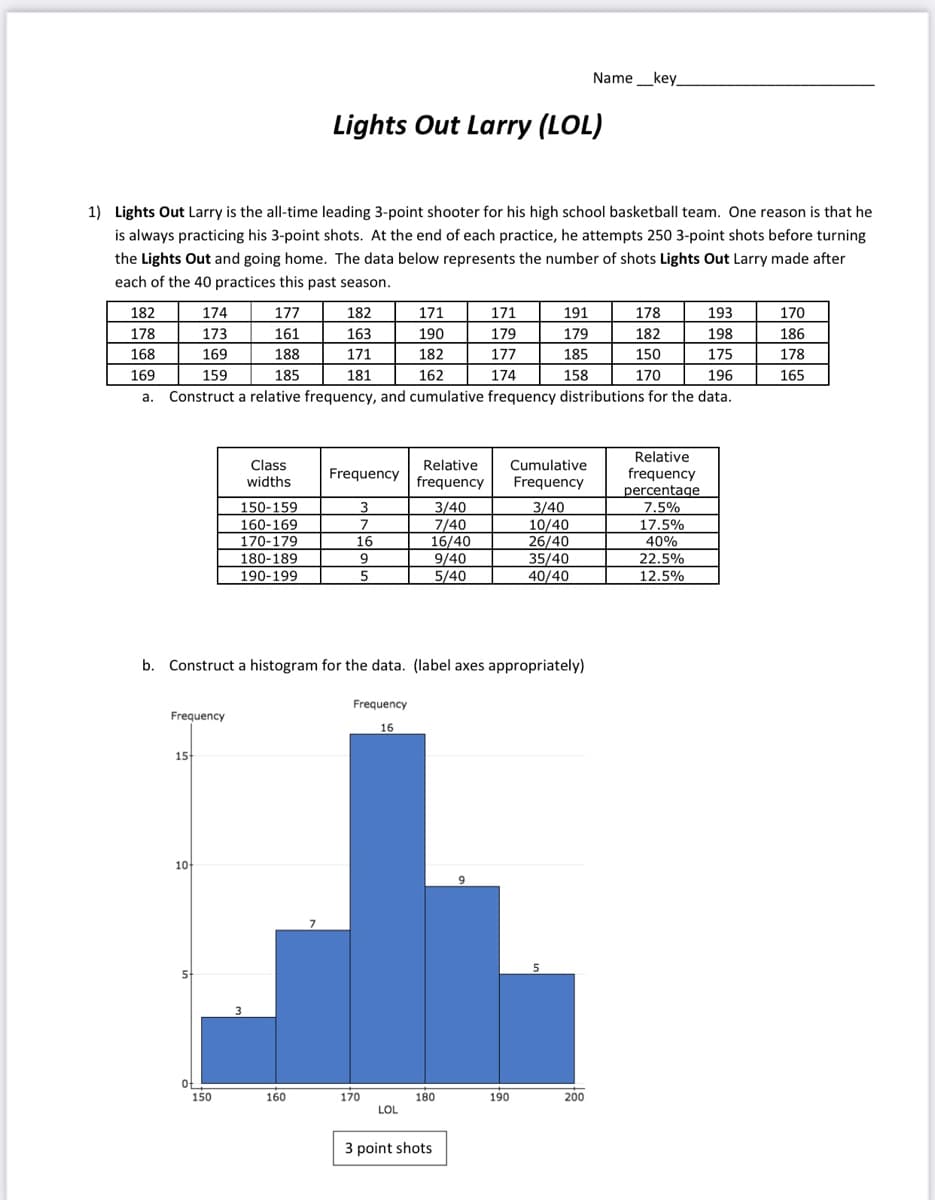
1) Lights Out Larry is the all-time leading 3-point shooter for his high school basketball team. One reason is that he is always practicing his 3-point shots. At the end of each practice, he attempts 250 3-point shots before turning the Lights Out and going home. The data below represents the number of shots Lights Out Larry made after each of the 40 practices this past season. 182 174 177 182 171 171 191 178 193 170 178 173 161 163 190 179 179 182 198 186 168 169 188 171 182 177 185 150 175 178 169 159 185 181 162 174 158 170 196 165 a. Construct a relative frequency, and cumulative frequency distributions for the data. Relative Relative frequency Class Cumulative Frequency frequency percentage 7.5% 17.5% widths Frequency 150-159 3 7 160-169 170-179 180-189 3/40 7/40 16/40 9/40 5/40 3/40 10/40 26/40 35/40 40/40 16 40% 22.5% 12.5% 9 190-199 5 b. Construct a histogram for the data. (label axes appropriately) Frequency Frequency 16 15 10 150 160 170 180 190 200 LOL 3 point shots
1) Lights Out Larry is the all-time leading 3-point shooter for his high school basketball team. One reason is that he is always practicing his 3-point shots. At the end of each practice, he attempts 250 3-point shots before turning the Lights Out and going home. The data below represents the number of shots Lights Out Larry made after each of the 40 practices this past season. 182 174 177 182 171 171 191 178 193 170 178 173 161 163 190 179 179 182 198 186 168 169 188 171 182 177 185 150 175 178 169 159 185 181 162 174 158 170 196 165 a. Construct a relative frequency, and cumulative frequency distributions for the data. Relative Relative frequency Class Cumulative Frequency frequency percentage 7.5% 17.5% widths Frequency 150-159 3 7 160-169 170-179 180-189 3/40 7/40 16/40 9/40 5/40 3/40 10/40 26/40 35/40 40/40 16 40% 22.5% 12.5% 9 190-199 5 b. Construct a histogram for the data. (label axes appropriately) Frequency Frequency 16 15 10 150 160 170 180 190 200 LOL 3 point shots

Glencoe Algebra 1, Student Edition, 9780079039897, 0079039898, 2018
18th Edition
ISBN:9780079039897
Author:Carter
Publisher:Carter
Chapter10: Statistics
Section10.6: Summarizing Categorical Data
Problem 23PPS

Related questions

Topic Video
Question
I need help i don’t understand this at all
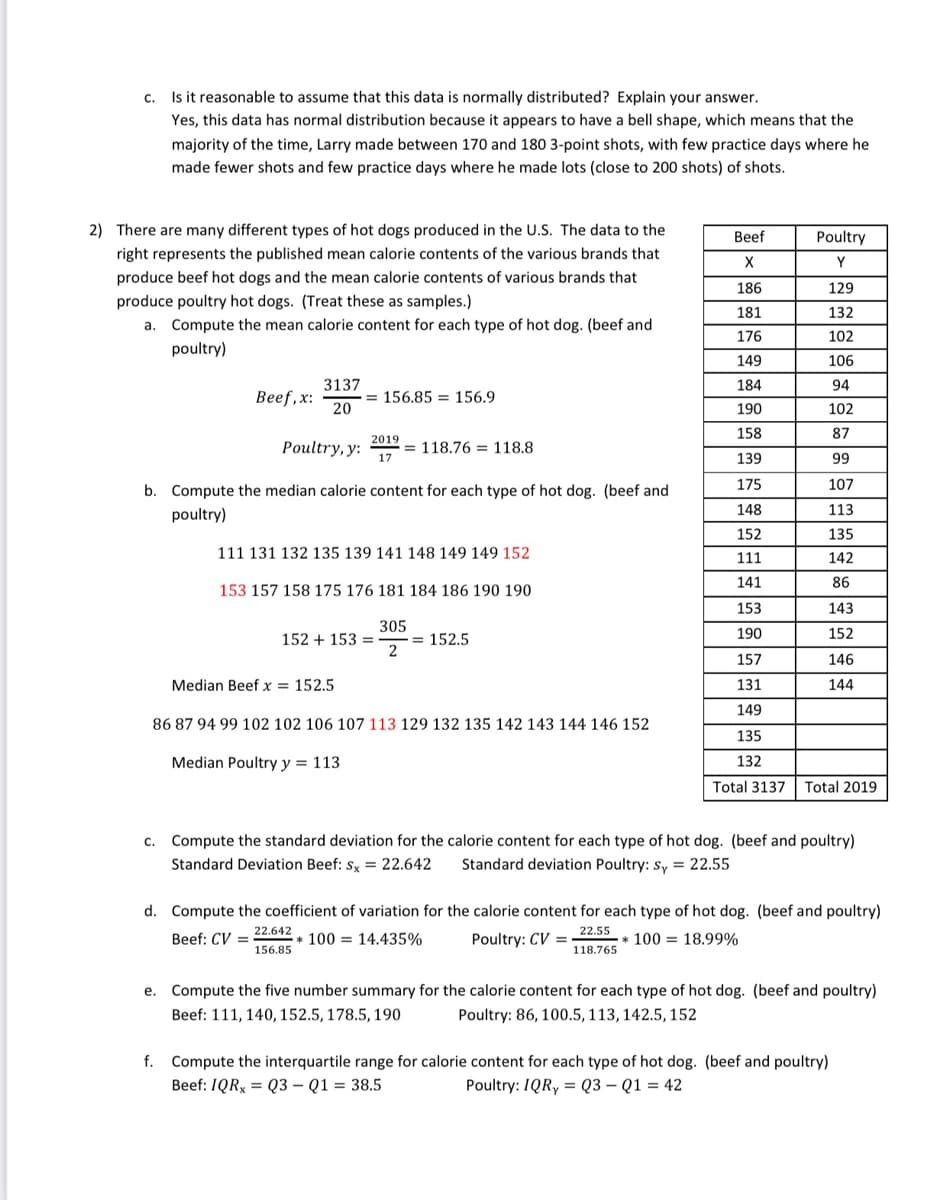
Transcribed Image Text:c. Is it reasonable to assume that this data is normally distributed? Explain your answer.
Yes, this data has normal distribution because it appears to have a bell shape, which means that the
majority of the time, Larry made between 170 and 180 3-point shots, with few practice days where he
made fewer shots and few practice days where he made lots (close to 200 shots) of shots.
2) There are many different types of hot dogs produced in the U.S. The data to the
Beef
Poultry
right represents the published mean calorie contents of the various brands that
Y
produce beef hot dogs and the mean calorie contents of various brands that
186
129
produce poultry hot dogs. (Treat these as samples.)
181
132
a. Compute the mean calorie content for each type of hot dog. (beef and
176
102
poultry)
149
106
3137
184
94
Веef, x:
= 156.85 = 156.9
20
190
102
158
87
2019
Poultry, y:
17
= 118.76 = 118.8
139
99
175
107
b. Compute the median calorie content for each type of hot dog. (beef and
148
113
poultry)
152
135
111 131 132 135 139 141 148 149 149 152
111
142
141
86
153 157 158 175 176 181 184 186 190 190
153
143
305
190
152
= 152.5
2
152 + 153 =
157
146
Median Beef x = 152.5
131
144
149
86 87 94 99 102 102 106 107 113 129 132 135 142 143 144 146 152
135
Median Poultry y = 113
132
Total 3137
Total 2019
c.
Compute the standard deviation for the calorie content for each type of hot dog. (beef and poultry)
Standard Deviation Beef: s, = 22.642
Standard deviation Poultry: Sy = 22.55
d. Compute the coefficient of variation for the calorie content for each type of hot dog. (beef and poultry)
22.642
22.55
Beef: CV =
* 100 = 14.435%
Poultry: CV =
* 100 = 18.99%
156.85
118.765
e. Compute the five number summary for the calorie content for each type of hot dog. (beef and poultry)
Beef: 111, 140, 152.5, 178.5, 190
Poultry: 86, 100.5, 113, 142.5, 152
f. Compute the interquartile range for calorie content for each type of hot dog. (beef and poultry)
Beef: IQR, = Q3 – Q1 = 38.5
Poultry: 1QRY = Q3 – Q1 = 42
Transcribed Image Text:Name_key
Lights Out Larry (LOL)
1) Lights Out Larry is the all-time leading 3-point shooter for his high school basketball team. One reason is that he
is always practicing his 3-point shots. At the end of each practice, he attempts 250 3-point shots before turning
the Lights Out and going home. The data below represents the number of shots Lights Out Larry made after
each of the 40 practices this past season.
182
174
177
182
171
171
191
178
193
170
178
173
161
163
190
179
179
182
198
186
168
169
188
171
182
177
185
150
175
178
169
159
185
181
162
174
158
170
196
165
а.
Construct a relative frequency, and cumulative frequency distributions for the data.
Relative
frequency
percentage
7.5%
17.5%
40%
Relative
Class
widths
Cumulative
Frequency
frequency
Frequency
150-159
3.
3/40
7/40
3/40
10/40
26/40
35/40
40/40
160-169
170-179
16
16/40
9/40
22.5%
12.5%
180-189
9
190-199
5
5/40
b. Construct a histogram for the data. (label axes appropriately)
Frequency
Frequency
16
15
10
150
160
170
180
190
200
LOL
3 point shots
Expert Solution
This question has been solved!
Explore an expertly crafted, step-by-step solution for a thorough understanding of key concepts.

This is a popular solution!

Trending now
This is a popular solution!

Step by step
Solved in 3 steps

Knowledge Booster


Learn more about
Need a deep-dive on the concept behind this application? Look no further. Learn more about this topic, statistics and related others by exploring similar questions and additional content below.Recommended textbooks for you
Glencoe Algebra 1, Student Edition, 9780079039897…
Algebra
ISBN:
9780079039897
Author:
Carter
Publisher:
McGraw Hill

Holt Mcdougal Larson Pre-algebra: Student Edition…
Algebra
ISBN:
9780547587776
Author:
HOLT MCDOUGAL
Publisher:
HOLT MCDOUGAL
Glencoe Algebra 1, Student Edition, 9780079039897…
Algebra
ISBN:
9780079039897
Author:
Carter
Publisher:
McGraw Hill
Holt Mcdougal Larson Pre-algebra: Student Edition…
Algebra
ISBN:
9780547587776
Author:
HOLT MCDOUGAL
Publisher:
HOLT MCDOUGAL