10. Using your test statistic, use EXCEL or the table to determine the P-value. (If you choose to use the table, the range that the table gives should help you select the correct value below.) a. 0.00088 b. 0.391 C. 0.0056 d. 0.0196 Ans. 11. Instead of using your result above, let's say your P-value turned out to be 0.001. What would you conclude? a. Reject the Null. At a = 0.01 the data indicate there is a negative population correlation. b. Reject the Null. At a = 0.01 the data indicate there is a positive population correlation. Fail to reject Null. At a = 0.01 the data indicate there is a positive population correlation d. Fail to reject Null. At a = 0.01 the data indicate there is not a positive population C. correlation. Ans.
10. Using your test statistic, use EXCEL or the table to determine the P-value. (If you choose to use the table, the range that the table gives should help you select the correct value below.) a. 0.00088 b. 0.391 C. 0.0056 d. 0.0196 Ans. 11. Instead of using your result above, let's say your P-value turned out to be 0.001. What would you conclude? a. Reject the Null. At a = 0.01 the data indicate there is a negative population correlation. b. Reject the Null. At a = 0.01 the data indicate there is a positive population correlation. Fail to reject Null. At a = 0.01 the data indicate there is a positive population correlation d. Fail to reject Null. At a = 0.01 the data indicate there is not a positive population C. correlation. Ans.

MATLAB: An Introduction with Applications
6th Edition
ISBN:9781119256830
Author:Amos Gilat
Publisher:Amos Gilat
Chapter1: Starting With Matlab
Section: Chapter Questions
Problem 1P

Related questions
Question
Help me solve questions 10 and 11 with the following information. Please and thank you
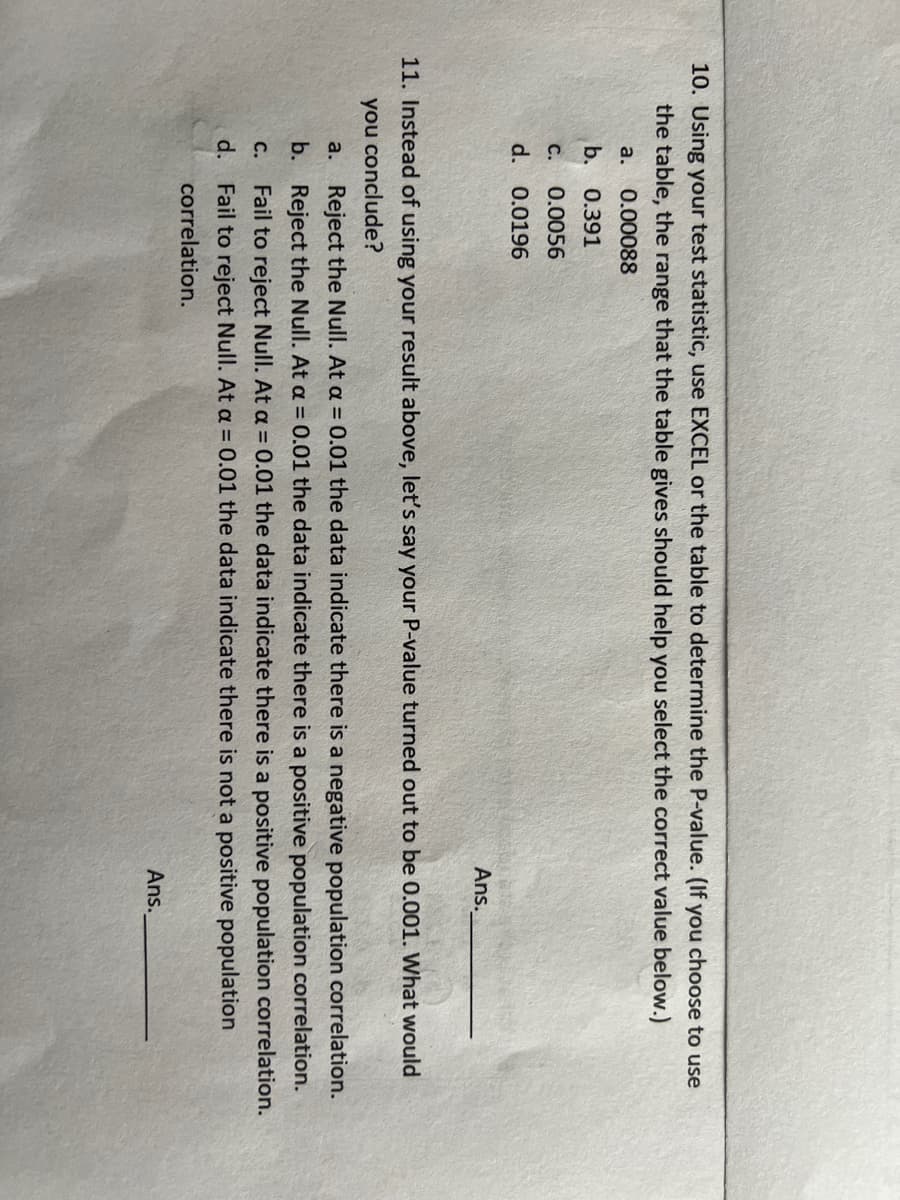
Transcribed Image Text:10. Using your test statistic, use EXCEL or the table to determine the P-value. (If you choose to use
the table, the range that the table gives should help you select the correct value below.)
a.
0.00088
b. 0.391
C. 0.0056
d. 0.0196
Ans.
11. Instead of using your result above, let's say your P-value turned out to be 0.001. What would
you conclude?
a. Reject the Null. At a = 0.01 the data indicate there is a negative population correlation.
b. Reject the Null. At a = 0.01 the data indicate there is a positive population correlation.
C.
Fail to reject Null. At a = 0.01 the data indicate there is a positive population correlation.
d. Fail to reject Null. At a = 0.01 the data indicate there is not a positive population
correlation.
Ans.
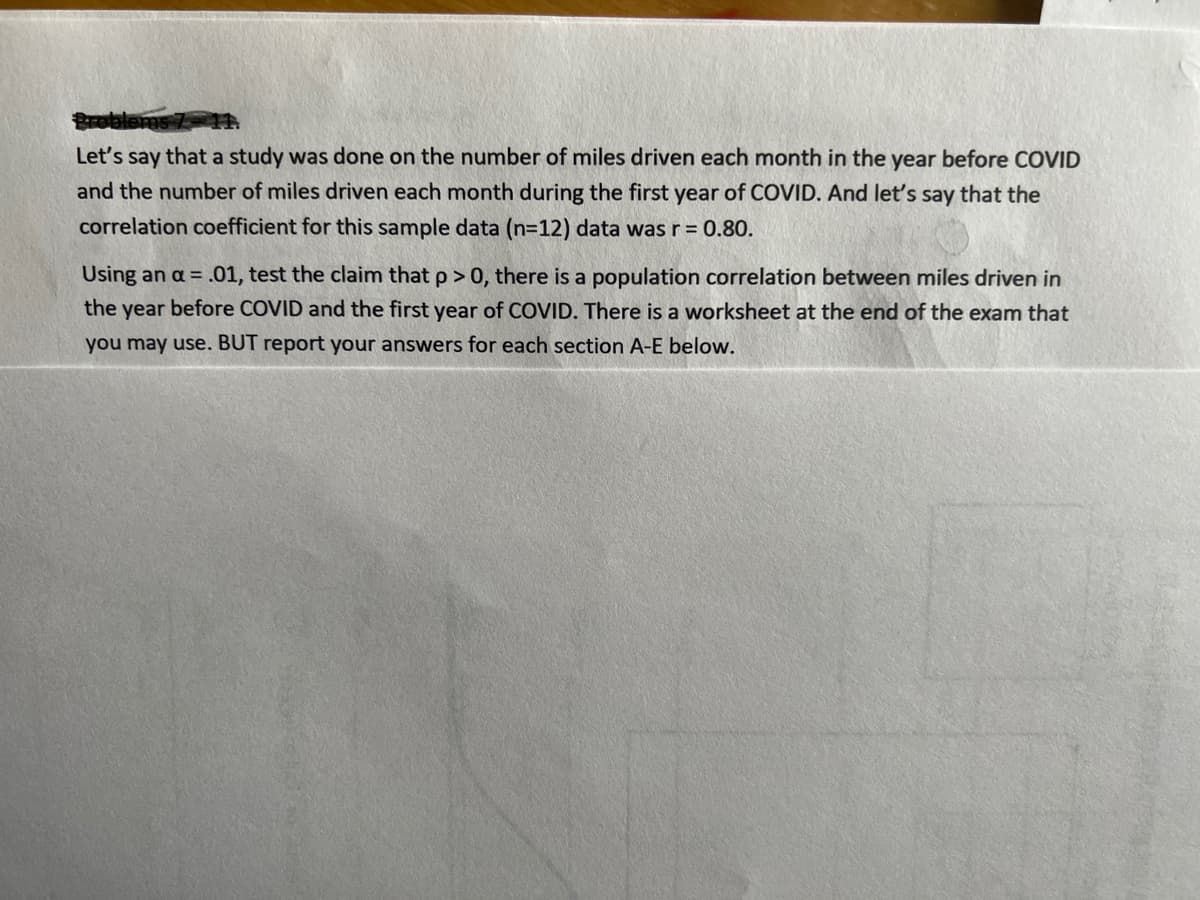
Transcribed Image Text:Problems 7-11.
Let's say that a study was done on the number of miles driven each month in the year before COVID
and the number of miles driven each month during the first year of COVID. And let's say that the
correlation coefficient for this sample data (n=12) data was r = 0.80.
Using an a = .01, test the claim that p > 0, there is a population correlation between miles driven in
the year before COVID and the first year of COVID. There is a worksheet at the end of the exam that
you may use. BUT report your answers for each section A-E below.
Expert Solution
This question has been solved!
Explore an expertly crafted, step-by-step solution for a thorough understanding of key concepts.

Step by step
Solved in 3 steps with 1 images

Recommended textbooks for you
MATLAB: An Introduction with Applications
Statistics
ISBN:
9781119256830
Author:
Amos Gilat
Publisher:
John Wiley & Sons Inc

Probability and Statistics for Engineering and th…
Statistics
ISBN:
9781305251809
Author:
Jay L. Devore
Publisher:
Cengage Learning

Statistics for The Behavioral Sciences (MindTap C…
Statistics
ISBN:
9781305504912
Author:
Frederick J Gravetter, Larry B. Wallnau
Publisher:
Cengage Learning
MATLAB: An Introduction with Applications
Statistics
ISBN:
9781119256830
Author:
Amos Gilat
Publisher:
John Wiley & Sons Inc
Probability and Statistics for Engineering and th…
Statistics
ISBN:
9781305251809
Author:
Jay L. Devore
Publisher:
Cengage Learning
Statistics for The Behavioral Sciences (MindTap C…
Statistics
ISBN:
9781305504912
Author:
Frederick J Gravetter, Larry B. Wallnau
Publisher:
Cengage Learning

Elementary Statistics: Picturing the World (7th E…
Statistics
ISBN:
9780134683416
Author:
Ron Larson, Betsy Farber
Publisher:
PEARSON

The Basic Practice of Statistics
Statistics
ISBN:
9781319042578
Author:
David S. Moore, William I. Notz, Michael A. Fligner
Publisher:
W. H. Freeman

Introduction to the Practice of Statistics
Statistics
ISBN:
9781319013387
Author:
David S. Moore, George P. McCabe, Bruce A. Craig
Publisher:
W. H. Freeman