10.0 8.0 D pH 60 4.0 20 0.0 c D 0 5 10 15 20 25 30 mL of 0.1 M NaOH The graph above shows the titration curves of four monoprotic acids of varying strengths. All of the acids start out at 0.1 M concentration and 25.0 mL volume. Choose all of the correct statements about these Citration curves from the choices below. The titration curve labelled "D" is generated by the strongest acid in the series. In the curves shown above the stronger the acid the less NaOH required for neutralization. The stronger the acid the more important is the pK, of the Indicator used for titration. The Ka of the acid which generates curve "C" is about 103 The weaker the acid the lower the pH of the neutralization point. The acid which generates curve "D" has the highest neutralization-point pH in the series.
10.0 8.0 D pH 60 4.0 20 0.0 c D 0 5 10 15 20 25 30 mL of 0.1 M NaOH The graph above shows the titration curves of four monoprotic acids of varying strengths. All of the acids start out at 0.1 M concentration and 25.0 mL volume. Choose all of the correct statements about these Citration curves from the choices below. The titration curve labelled "D" is generated by the strongest acid in the series. In the curves shown above the stronger the acid the less NaOH required for neutralization. The stronger the acid the more important is the pK, of the Indicator used for titration. The Ka of the acid which generates curve "C" is about 103 The weaker the acid the lower the pH of the neutralization point. The acid which generates curve "D" has the highest neutralization-point pH in the series.

Chapter15: Acid-base Equilibria
Section: Chapter Questions
Problem 90AE: The following plot shows the pH curves for the titrations of various acids by 0.10 M NaOH (all of...

Related questions

Question
Transcribed Image Text:12.0
10.0
8.0
pH 6.0
4.0
C
2.0
0.0
D
0 5 10 15 20 25 30
mL of 0.1 M NaOH
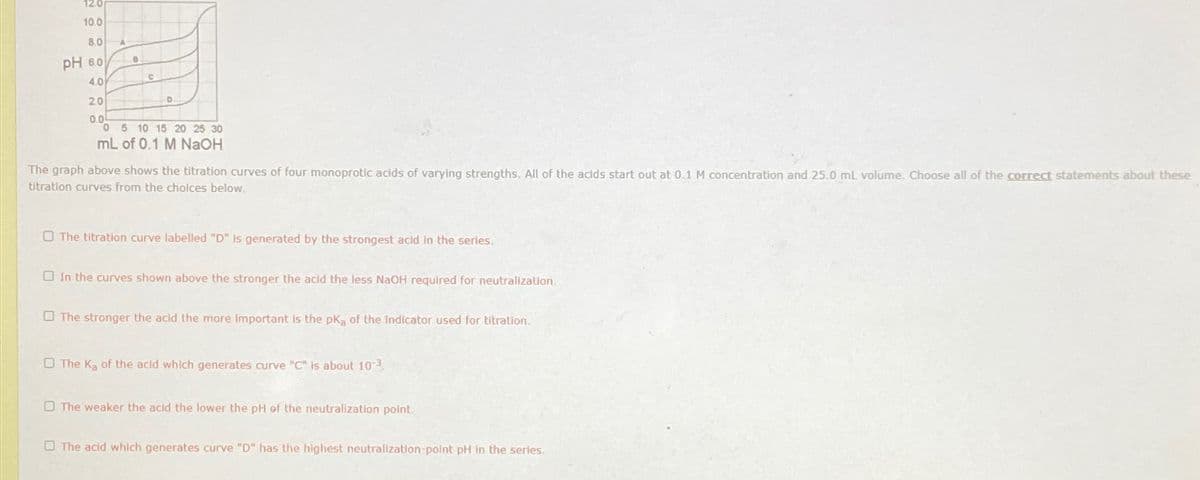
The graph above shows the titration curves of four monoprotic acids of varying strengths. All of the acids start out at 0.1 M concentration and 25.0 mL volume. Choose all of the correct statements about these
titration curves from the cholces below.
The titration curve labelled "D" is generated by the strongest acid in the series.
In the curves shown above the stronger the acid the less NaOH required for neutralization.
The stronger the acid the more important is the pKa of the Indicator used for titration.
The Ka of the acid which generates curve "C" is about 103
The weaker the acid the lower the pH of the neutralization point.
The acid which generates curve "D" has the highest neutralization-point pH in the series.
Expert Solution
This question has been solved!
Explore an expertly crafted, step-by-step solution for a thorough understanding of key concepts.

Step by step
Solved in 3 steps with 14 images

Knowledge Booster


Learn more about
Need a deep-dive on the concept behind this application? Look no further. Learn more about this topic, chemistry and related others by exploring similar questions and additional content below.Recommended textbooks for you

Chemistry: An Atoms First Approach
Chemistry
ISBN:
9781305079243
Author:
Steven S. Zumdahl, Susan A. Zumdahl
Publisher:
Cengage Learning

Chemistry
Chemistry
ISBN:
9781305957404
Author:
Steven S. Zumdahl, Susan A. Zumdahl, Donald J. DeCoste
Publisher:
Cengage Learning
Chemistry: An Atoms First Approach
Chemistry
ISBN:
9781305079243
Author:
Steven S. Zumdahl, Susan A. Zumdahl
Publisher:
Cengage Learning
Chemistry
Chemistry
ISBN:
9781305957404
Author:
Steven S. Zumdahl, Susan A. Zumdahl, Donald J. DeCoste
Publisher:
Cengage Learning

Chemistry: The Molecular Science
Chemistry
ISBN:
9781285199047
Author:
John W. Moore, Conrad L. Stanitski
Publisher:
Cengage Learning

Chemistry: Principles and Reactions
Chemistry
ISBN:
9781305079373
Author:
William L. Masterton, Cecile N. Hurley
Publisher:
Cengage Learning

Chemistry & Chemical Reactivity
Chemistry
ISBN:
9781337399074
Author:
John C. Kotz, Paul M. Treichel, John Townsend, David Treichel
Publisher:
Cengage Learning