10.34 Refer to Exercise 10.33. The following information displays the education distribution of 1,000 jurors and the education distribution countywide. Education Level Elementary Secondary College Credits College Degree Total Number of jurors Education % countywide 278 523 98 101 1,000 39.2 40.5 9.1 112 100 a. Display the above data using appropriate graphs. b. Is this significant evidence of a difference between the education distribution of jurors and the countywide education distribution? c. Does there appear to be bias in the selection of jurors with respect to the educa- tion level of jurors?
10.34 Refer to Exercise 10.33. The following information displays the education distribution of 1,000 jurors and the education distribution countywide. Education Level Elementary Secondary College Credits College Degree Total Number of jurors Education % countywide 278 523 98 101 1,000 39.2 40.5 9.1 112 100 a. Display the above data using appropriate graphs. b. Is this significant evidence of a difference between the education distribution of jurors and the countywide education distribution? c. Does there appear to be bias in the selection of jurors with respect to the educa- tion level of jurors?

Holt Mcdougal Larson Pre-algebra: Student Edition 2012
1st Edition
ISBN:9780547587776
Author:HOLT MCDOUGAL
Publisher:HOLT MCDOUGAL
Chapter11: Data Analysis And Probability
Section: Chapter Questions
Problem 8CR

Related questions
Question
Transcribed Image Text:Question 4
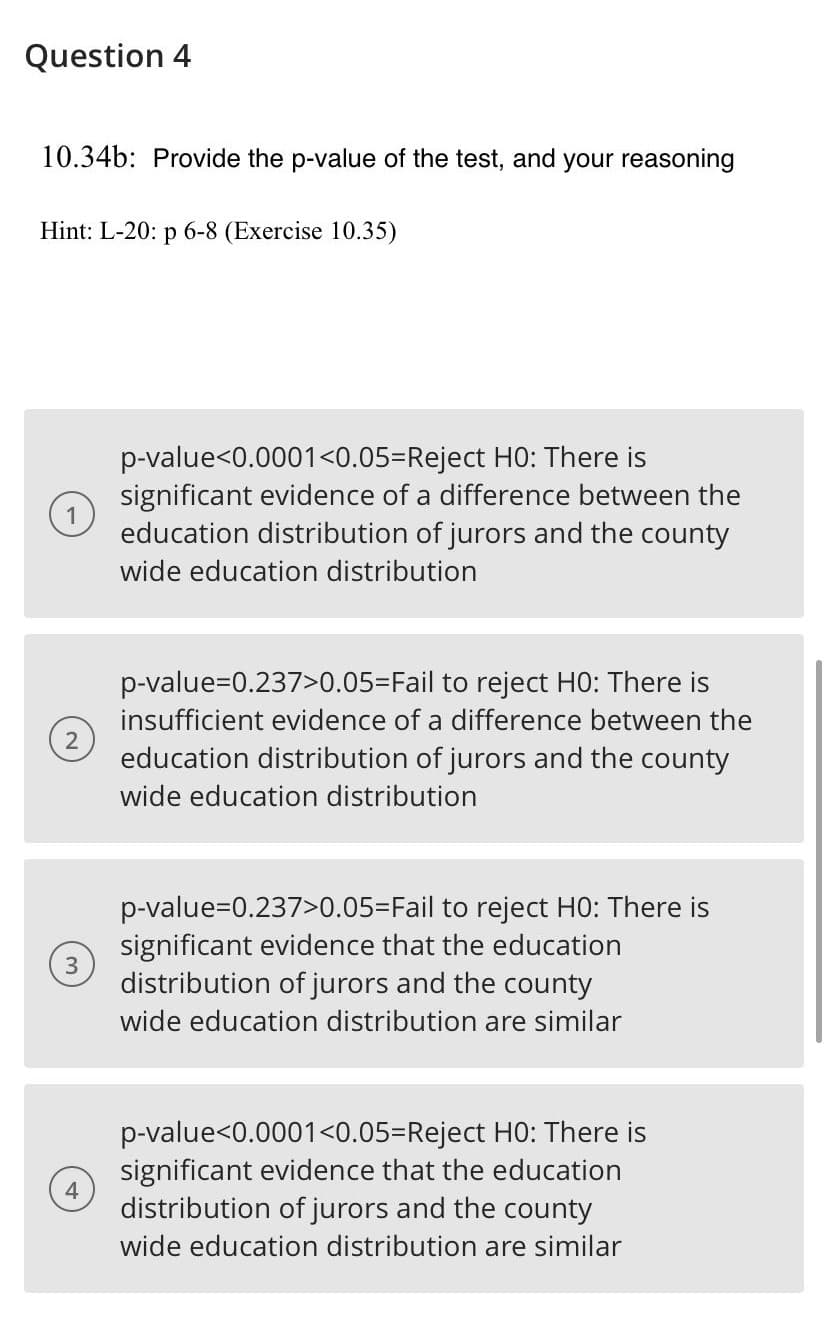
10.34b: Provide the p-value of the test, and your reasoning
Hint: L-20: p 6-8 (Exercise 10.35)
p-value<0.0001<0.05=Reject H0: There is
significant evidence of a difference between the
education distribution of jurors and the county
wide education distribution
p-value=0.237>0.05=Fail to reject HO: There is
insufficient evidence of a difference between the
education distribution of jurors and the county
wide education distribution
p-value=0.237>0.05%3Fail to reject HO: There is
significant evidence that the education
3
distribution of jurors and the county
wide education distribution are similar
p-value<0.0001<0.05=Reject H0: There is
significant evidence that the education
4
distribution of jurors and the county
wide education distribution are similar
Transcribed Image Text:Soc.
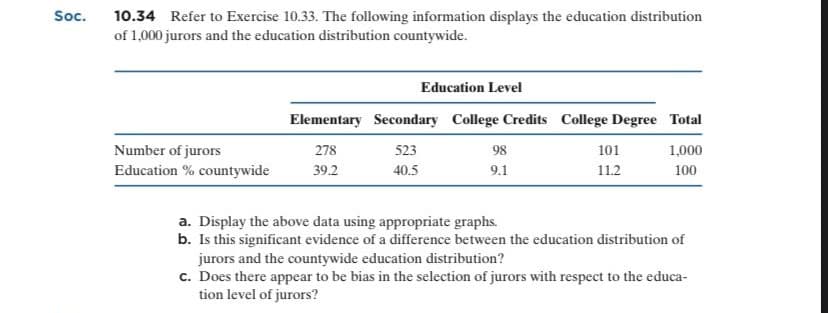
10.34 Refer to Exercise 10.33. The following information displays the education distribution
of 1,000 jurors and the education distribution countywide.
Education Level
Elementary Secondary College Credits College Degree Total
Number of jurors
278
523
98
101
1,000
Education % countywide
39.2
40.5
9.1
11.2
100
a. Display the above data using appropriate graphs.
b. Is this significant evidence of a difference between the education distribution of
jurors and the countywide education distribution?
c. Does there appear to be bias in the selection of jurors with respect to the educa-
tion level of jurors?
Expert Solution
This question has been solved!
Explore an expertly crafted, step-by-step solution for a thorough understanding of key concepts.

This is a popular solution!

Trending now
This is a popular solution!

Step by step
Solved in 3 steps with 3 images

Recommended textbooks for you
Holt Mcdougal Larson Pre-algebra: Student Edition…
Algebra
ISBN:
9780547587776
Author:
HOLT MCDOUGAL
Publisher:
HOLT MCDOUGAL
Holt Mcdougal Larson Pre-algebra: Student Edition…
Algebra
ISBN:
9780547587776
Author:
HOLT MCDOUGAL
Publisher:
HOLT MCDOUGAL