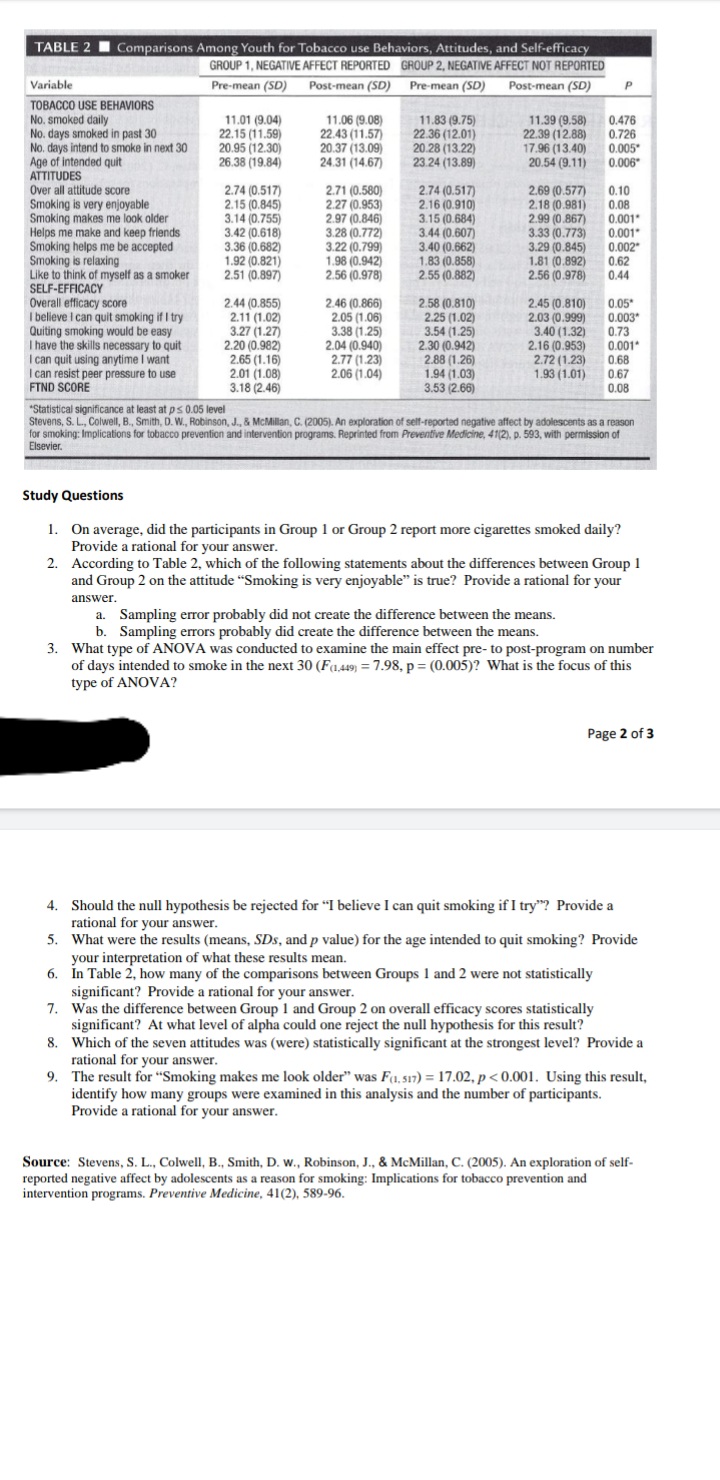
TABLE 2 Comparisons Among Youth for Tobacco use Behaviors, Attitudes, and Self-efficacy GROUP 1, NEGATIVE AFFECT REPORTED GROUP 2, NEGATIVE AFFECT NOT REPORTED Variable Pre-mean (SD) Post-mean (SD) Pre-mean (SD) Post-mean (SD) TOBACCO USE BEHAVIORS No, smoked daily No. days smoked in past 30 No. days intend to smoke in next 30 Age of intended quit ATTITUDES Over all attitude score Smoking is very enjoyable Smoking makes me look older Helps me make and keep friends Smoking helps me be accepted Smoking is relaxing Like to think of myself as a smoker SELF-EFFICACY Overall efficacy score I believe I can quit smoking if I try Quiting smoking would be easy I have the skills necessary to quit I can quit using anytime I want I can resist peer pressure to use FTND SCORE 11.01 (9.04) 22.15 (11.59) 20.95 (12.30) 26.38 (19.84) 11.06 (9.08) 22.43 (11.57) 20.37 (13.09) 24.31 (14.67) 11.83 (9.75) 22.36 (12.01) 20.28 (13.22) 23.24 (13.89) 11.39 (9.58) 22.39 (12.88) 17.96 (13.40) 20.54 (9.11) 0.476 0.726 0.005 0.006 2.74 (0.517) 2.15 (0.845) 3.14 (0.755) 3.42 (0.618) 3.36 (0.682) 1.92 (0.821) 2.51 (0.897) 2.71 (0.580) 2.27 (0.953) 2.97 (0.846) 3.28 (0.772) 3.22 (0.799) 1.98 (0.942) 2.56 (0.978) 2.74 (0.517) 2.16 (0.910) 3.15 (0.684) 3.44 (0.607) 3.40 (0.662) 1.83 (0.858) 2.55 (0.882) 2.69 (0.577) 2.18 (0.981) 2.99 (0.867) 3.33 (0.773) 3.29 (0.845) 1.81 (0.892) 2.56 (0.978) 0.10 0.08 0.001 0.001 0.002 0.62 0.44 2.45 (0.810) 2.03 (0.999) 3.40 (1.32) 2.44 (0.855) 2.11 (1.02) 3.27 (1.27) 2.20 (0.982) 2.65 (1.16) 2.01 (1.08) 3.18 (2.46) 2.46 (0.866) 2.05 (1.06) 3.38 (1.25) 2.04 (0.940) 2.77 (1.23) 2.06 (1.04) 2.58 (0.810) 2.25 (1.02) 3.54 (1.25) 2.30 (0.942) 2.88 (1.26) 1.94 (1.03) 3.53 (2.66) 0.05 0.003 0.73 0.001 0.68 0.67 0.08 2.16 (0.953) 2.72 (1.23) 1.93 (1.01) *Statistical significance at least at ps 0.05 level Stevens, S. L., Colwell, B., Smith, D. W., Robinson, J., & McMillan, C. (2005). An exploration of self-reported negative affect by adolescents as a reason for smoking: Implications for tobacco prevention and intervention programs. Reprinted from Preventive Medicine, 41(2), p. 593, with permission of Elsevier. Study Questions 1. On average, did the participants in Group 1 or Group 2 report more cigarettes smoked daily? Provide a rational for your answer. 2. According to Table 2, which of the following statements about the differences between Group 1 and Group 2 on the attitude "Smoking is very enjoyable" is true? Provide a rational for your answer. a. Sampling error probably did not create the difference between the means. b. Sampling errors probably did create the difference between the means. 3. What type of ANOVA was conducted to examine the main effect pre- to post-program on number of days intended to smoke in the next 30 (Fa,49) = 7.98, p = (0.005)? What is the focus of this type of ANOVA? Page 2 of 3 4. Should the null hypothesis be rejected for "I believe I can quit smoking if I try"? Provide a rational for your answer. 5. What were the results (means, SDs, and p value) for the age intended to quit smoking? Provide your interpretation of what these results mean. 6. In Table 2, how many of the comparisons between Groups 1 and 2 were not statistically significant? Provide a rational for your answer.
TABLE 2 Comparisons Among Youth for Tobacco use Behaviors, Attitudes, and Self-efficacy GROUP 1, NEGATIVE AFFECT REPORTED GROUP 2, NEGATIVE AFFECT NOT REPORTED Variable Pre-mean (SD) Post-mean (SD) Pre-mean (SD) Post-mean (SD) TOBACCO USE BEHAVIORS No, smoked daily No. days smoked in past 30 No. days intend to smoke in next 30 Age of intended quit ATTITUDES Over all attitude score Smoking is very enjoyable Smoking makes me look older Helps me make and keep friends Smoking helps me be accepted Smoking is relaxing Like to think of myself as a smoker SELF-EFFICACY Overall efficacy score I believe I can quit smoking if I try Quiting smoking would be easy I have the skills necessary to quit I can quit using anytime I want I can resist peer pressure to use FTND SCORE 11.01 (9.04) 22.15 (11.59) 20.95 (12.30) 26.38 (19.84) 11.06 (9.08) 22.43 (11.57) 20.37 (13.09) 24.31 (14.67) 11.83 (9.75) 22.36 (12.01) 20.28 (13.22) 23.24 (13.89) 11.39 (9.58) 22.39 (12.88) 17.96 (13.40) 20.54 (9.11) 0.476 0.726 0.005 0.006 2.74 (0.517) 2.15 (0.845) 3.14 (0.755) 3.42 (0.618) 3.36 (0.682) 1.92 (0.821) 2.51 (0.897) 2.71 (0.580) 2.27 (0.953) 2.97 (0.846) 3.28 (0.772) 3.22 (0.799) 1.98 (0.942) 2.56 (0.978) 2.74 (0.517) 2.16 (0.910) 3.15 (0.684) 3.44 (0.607) 3.40 (0.662) 1.83 (0.858) 2.55 (0.882) 2.69 (0.577) 2.18 (0.981) 2.99 (0.867) 3.33 (0.773) 3.29 (0.845) 1.81 (0.892) 2.56 (0.978) 0.10 0.08 0.001 0.001 0.002 0.62 0.44 2.45 (0.810) 2.03 (0.999) 3.40 (1.32) 2.44 (0.855) 2.11 (1.02) 3.27 (1.27) 2.20 (0.982) 2.65 (1.16) 2.01 (1.08) 3.18 (2.46) 2.46 (0.866) 2.05 (1.06) 3.38 (1.25) 2.04 (0.940) 2.77 (1.23) 2.06 (1.04) 2.58 (0.810) 2.25 (1.02) 3.54 (1.25) 2.30 (0.942) 2.88 (1.26) 1.94 (1.03) 3.53 (2.66) 0.05 0.003 0.73 0.001 0.68 0.67 0.08 2.16 (0.953) 2.72 (1.23) 1.93 (1.01) *Statistical significance at least at ps 0.05 level Stevens, S. L., Colwell, B., Smith, D. W., Robinson, J., & McMillan, C. (2005). An exploration of self-reported negative affect by adolescents as a reason for smoking: Implications for tobacco prevention and intervention programs. Reprinted from Preventive Medicine, 41(2), p. 593, with permission of Elsevier. Study Questions 1. On average, did the participants in Group 1 or Group 2 report more cigarettes smoked daily? Provide a rational for your answer. 2. According to Table 2, which of the following statements about the differences between Group 1 and Group 2 on the attitude "Smoking is very enjoyable" is true? Provide a rational for your answer. a. Sampling error probably did not create the difference between the means. b. Sampling errors probably did create the difference between the means. 3. What type of ANOVA was conducted to examine the main effect pre- to post-program on number of days intended to smoke in the next 30 (Fa,49) = 7.98, p = (0.005)? What is the focus of this type of ANOVA? Page 2 of 3 4. Should the null hypothesis be rejected for "I believe I can quit smoking if I try"? Provide a rational for your answer. 5. What were the results (means, SDs, and p value) for the age intended to quit smoking? Provide your interpretation of what these results mean. 6. In Table 2, how many of the comparisons between Groups 1 and 2 were not statistically significant? Provide a rational for your answer.

Glencoe Algebra 1, Student Edition, 9780079039897, 0079039898, 2018
18th Edition
ISBN:9780079039897
Author:Carter
Publisher:Carter
Chapter10: Statistics
Section10.6: Summarizing Categorical Data
Problem 23PPS

Related questions
Question
Can you answer #6?
Transcribed Image Text:TABLE 2 I Comparisons Among Youth for Tobacco use Behaviors, Attitudes, and Self-efficacy
GROUP 1, NEGATIVE AFFECT REPORTED GROUP 2, NEGATIVE AFFECT NOT REPORTED
Variable
Pre-mean (SD)
Post-mean (SD)
Pre-mean (SD)
Post-mean (SD)
TOBACCO USE BEHAVIORS
No. smoked daily
No. days smoked in past 30
No. days intend to smoke in next 30
Age of intended quit
ATTITUDES
Over all attitude score
Smoking is very enjoyable
Smoking makes me look older
Helps me make and keep friends
Smoking helps me be accepted
Smoking is relaxing
Like to think of myself as a smoker
11.01 (9.04)
22.15 (11.59)
20.95 (12.30)
26.38 (19.84)
11.06 (9.08)
22.43 (11.57)
20.37 (13.09)
24.31 (14.67)
11.83 (9.75)
22.36 (12.01)
20.28 (13.22)
23.24 (13.89)
11.39 (9.58)
22.39 (12.88)
17.96 (13.40)
20.54 (9.11)
0.476
0.726
0.005
0.006*
2.74 (0.517)
2.15 (0.845)
3.14 (0.755)
3.42 (0.618)
3.36 (0.682)
1.92 (0.821)
2.51 (0.897)
2.71 (0.580)
2.27 (0.953)
2.97 (0.846)
3.28 (0.772)
3.22 (0.799)
1.98 (0.942)
2.56 (0.978)
2.74 (0.517)
2.16 (0.910)
3.15 (0.684)
3.44 (0.607)
3.40 (0.662)
1.83 (0.858)
2.55 (0.882)
2.69 (0.577)
2.18 (0.981)
2.99 (0.867)
3.33 (0.773)
3.29 (0.845)
1.81 (0.892)
2.56 (0.978)
0.10
0.08
0,001
0.001
0.002
0.62
0.44
SELF-EFFICACY
Overall efficacy score
I believe I can quit smoking if I try
Quiting smoking would be easy
I have the skills necessary to quit
I can quit using anytime I want
I can resist peer pressure to use
FTND SCORE
2.44 (0.855)
2.11 (1.02)
3.27 (1.27)
2.20 (0.982)
2.65 (1.16)
2.01 (1.08)
3.18 (2.46)
2.46 (0.866)
2.05 (1.06)
3.38 (1.25)
2.04 (0.940)
2.77 (1.23)
2.06 (1.04)
2.58 (0.810)
2.25 (1.02)
3.54 (1.25)
2.30 (0.942)
2.88 (1.26)
1.94 (1.03)
3.53 (2.66)
2.45 (0.810)
2.03 (0.999)
3.40 (1.32)
2.16 (0.953)
2.72 (1.23)
1.93 (1.01)
0.05"
0.003"
0.73
0.001
0.68
0.67
0.08
*Statistical significance at least at ps0.05 level
Stevens, S. L., Colwell, B., Smith, D. W., Robinson, J., & McMillan, C. (2005). An exploration of self-reported negative affect by adolescents as a reason
for smoking: Implications for tobacco prevention and intervention programs. Reprinted from Preventive Medicine, 41(2), p. 593, with permission of
Elsevier.
Study Questions
1. On average, did the participants in Group 1 or Group 2 report more cigarettes smoked daily?
Provide a rational for your answer.
2. According to Table 2, which of the following statements about the differences between Group 1
and Group 2 on the attitude "Smoking is very enjoyable" is true? Provide a rational for your
answer.
a. Sampling error probably did not create the difference between the means.
b. Sampling errors probably did create the difference between the means.
3. What type of ANOVA was conducted to examine the main effect pre- to post-program on number
of days intended to smoke in the next 30 (F1.49) = 7.98, p = (0.005)? What is the focus of this
type of ANOVA?
Page 2 of 3
Should the null hypothesis be rejected for "I believe I can quit smoking if I try"? Provide a
rational for your answer.
4.
5. What were the results (means, SDs, and p value) for the age intended to quit smoking? Provide
your interpretation of what these results mean.
6. In Table 2, how many of the comparisons between Groups 1 and 2 were not statistically
significant? Provide a rational for your answer.
7. Was the difference between Group 1 and Group 2 on overall efficacy scores statistically
significant? At what level of alpha could one reject the null hypothesis for this result?
8. Which of the seven attitudes was (were) statistically significant at the strongest level? Provide a
rational for your answer.
9. The result for "Smoking makes me look older" was F1,517) = 17.02, p<0.001. Using this result,
identify how many groups were examined in this analysis and the number of participants.
Provide a rational for your answer.
Source: Stevens, S. L., Colwell, B., Smith, D. w., Robinson, J., & McMillan, C. (2005). An exploration of self-
reported negative affect by adolescents as a reason for smoking: Implications for tobacco prevention and
intervention programs. Preventive Medicine, 41(2), 589-96.
Expert Solution
Step 1
Given*
Statistically significant if
P-value 0.05

Trending now
This is a popular solution!

Step by step
Solved in 2 steps

Knowledge Booster


Learn more about
Need a deep-dive on the concept behind this application? Look no further. Learn more about this topic, statistics and related others by exploring similar questions and additional content below.Recommended textbooks for you
Glencoe Algebra 1, Student Edition, 9780079039897…
Algebra
ISBN:
9780079039897
Author:
Carter
Publisher:
McGraw Hill
Glencoe Algebra 1, Student Edition, 9780079039897…
Algebra
ISBN:
9780079039897
Author:
Carter
Publisher:
McGraw Hill