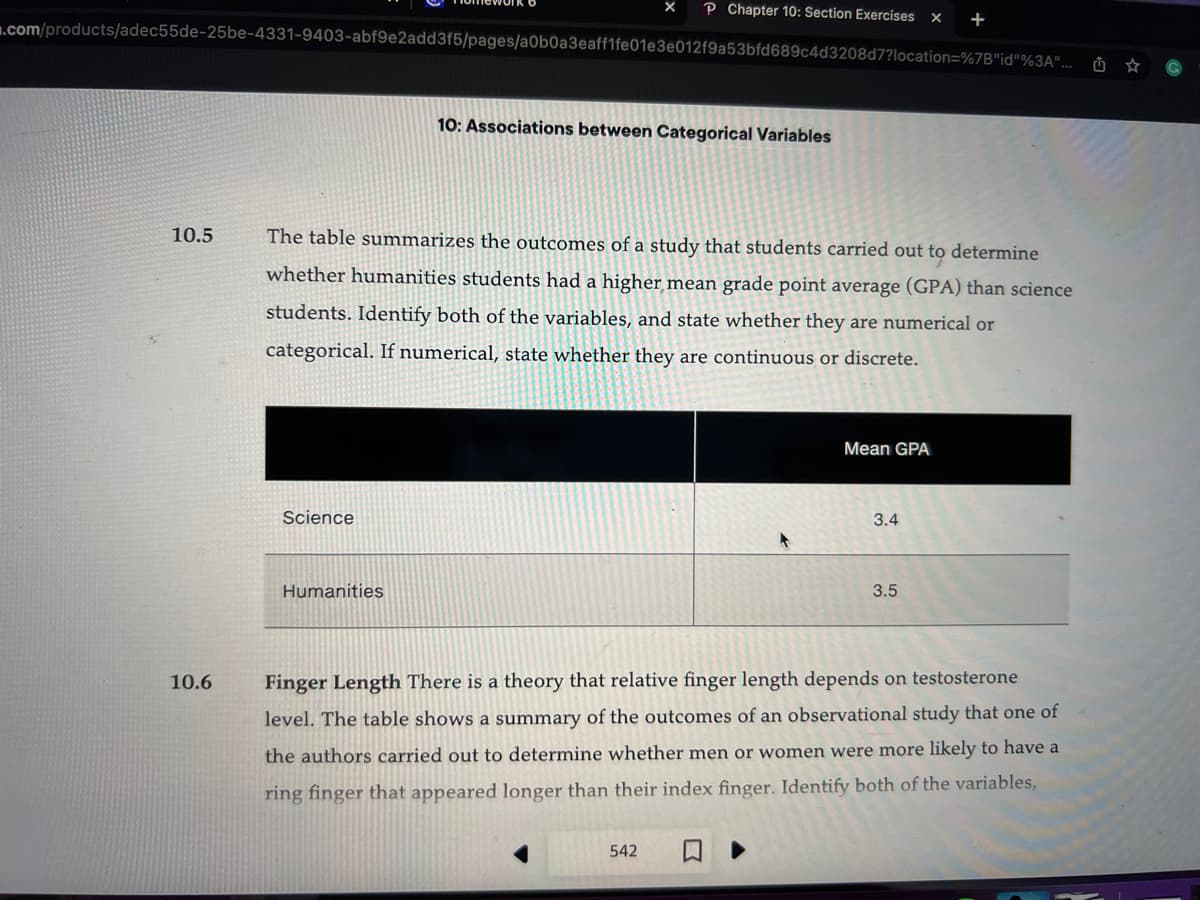
10.5 The table summarizes the outcomes of a study that students carried out to determine whether humanities students had a higher mean grade point average (GPA) than science students. Identify both of the variables, and state whether they are numerical or categorical. If numerical, state whether they are continuous or discrete. Science Humanities Mean GPA 3.4 3.5


Q: (a) Min = 1 (Simplify your answer.) Q₁ = 4.25 (Simplify your answer.) Q₂ = 7 (Simplify your answer.)…
A: It is given that the data in discrete form: 3,8,8,5,2,9,8,7,9,6,9,4,1,6,2,9,8,7,7,9
Q: 1,500 preferred candidate X for chairmanship and 850 did not prefer Y for secretary post. 300 were…
A: According to given question, we have the information that out of 2500 , 1,500 preferred candidate X…
Q: A local coach wants to see if training in light rooms or dark rooms impacts athlete performance.…
A: Statistical Testing: For the objective of evaluating the quantifiable information generated by a…
Q: A researcher wishes to estimate the number of households with two cars. How large a sample is needed…
A:
Q: A survey was conducted that asked 1018 people how many books they had read in the past year. Rosults…
A: Given Information: Sample size n=1018 Sample mean x¯=12.8 Standard deviation s=16.6
Q: X 1 2 3 y 1 X 1 2 5 7 Line A: y = -1 + 4x ŷ y 1 5 Complete the table for x, y, y, e, and e² for Line…
A: Given: x y 1 1 2 5 3 7
Q: a. What is the value of the standard error of the estimate (to 4 decimals)? 0.9726 . Test for a…
A: From given data: n=5, xi yi xi-x yi-y xi-x2 yi-y2 xi-xyi-y 2 7 -8 -9.6 64 92.16 76.8 6 18…
Q: A researcher claims that the stomachs of blue crabs from Location A contain more fish than the…
A: The given researcher claims is that the stomachs of blue crabs from Location A contains more fish…
Q: In this regression, which test statistic would you use to test the null hypothesis that the…
A: The prediction can be done by various time series method. It can be calculated using the regression…
Q: Determine whether the following statement is true or false. If it is false, rewrite it as a true…
A: The given statement is 'The mean is the measure of central tendency most likely to be affected by an…
Q: If the test statistic is 1.95 on the Z distribution at a 3% significance level for a right-sided…
A: According to the given information in this question We need to write the conclusion for the given…
Q: Question 5 Determine the following percentages for a z score of 0.7 (Feel free to show your work by…
A: Normal Distribution: The most conventional distribution tool for independent, randomized produced…
Q: û = ax + by, where a and b are real numbers. Find the expected value of this estimator in terms of a…
A:
Q: Naïve Average Moving Average Weighted Moving Average using the weights of .8, .15, and .05 with…
A: Given information: Period Sales 1 115 2 118 3 128 4 122 5 135 6 128 7 135 8 132…
Q: Suppose Z follows the standard normal distribution. Calculate the following probabilities using the…
A: Here, probabilities for normal distribution using ALEKS calculator are to be computed. Given: (a)…
Q: Choose the correct answer below. A. r=-0.922 represents a stronger correlation because |-0.922|>10.…
A: Two correlation coefficients are given. r=0.797 r=-0.922
Q: Assume that conditions are med inches (http://www.kidsgrowth.com). Male Height In the United States,…
A: Given that Let US COUNTRY :A NON US COUNTRY :B Mean Height of 3 Year Boys in a Country US is μA:38…
Q: It costs more to produce defective items—since they must be scrapped or reworked—than it does to…
A: Given : a. Margin of error (E) = 0.2 mm Confidence level (1-α) = 95% Significance level (α) = 5% SD…
Q: Using data below 2 3 4 13 19 Solid content [%] 01 Chemical oxygen demand [%) 0 5 11 a) Find 95%…
A:
Q: Match each data set to its likely standard deviation. {20, 36, 45, 49, 60, 67, 69, 72, 78, 80, 83,…
A: Given, Data , 20,36,45,49,60,67,69,72,78,80,83,87,89,89,91 Data,…
Q: (a) Find the five-number summary, and (b) draw a box-and-whisker plot of the data.…
A: Given that after arranging data into increasing order: 2, 2, 2, 3, 4, 6, 6, 6, 7, 7, 7, 8, 8, 8, 8,…
Q: Use technology to help you test the claim about the population mean, μ, at the given level of…
A: Given Population mean μ>1200, level of significance ɑ=0.07, sample mean x̄=1217.92, n=1200
Q: You are presented with the following data: Time spent doing homework/day (X) 0 0 0 20 30 45 80 127…
A: The following information has been provided: X Y 0 90 0 40 0 120 20 45 30 60 45 27…
Q: A radio disc jockey has 8 songs on this upcoming hour's playlist: 3 are rock songs, 2 are reggae…
A: Given information: Total number of songs on this upcoming hour's playlist = 8 Number of rock songs =…
Q: items produced 3. In the past the average proportion of by a certain process has been 3 per cent and…
A: Given that, p¯=0.03 Sample size, n is 30
Q: A biology researcher is studying the risk of extinction of a rare tree species in a remote part of…
A:
Q: The manager chooses to systematically sample 300 employees out of 2700 employees in the factory. iv)…
A: It is given that Sample size n = 300 Population size N = 2700
Q: If I have to carry out a rigorous inspection and I have a population of 300.00, how much sample…
A: Note: As per guidelines we will solve the first question only, please repost other questions for…
Q: A simple random sample of 100 observations was taken from a large population. The sample mean and…
A: According to the given information in this question We need to find standard error
Q: Question: Which of the following is FALSI transformations of a distribution? A: The centre of the…
A: Linear Transformation: A linear transformation is a change applied to a variable by one or more…
Q: A sample mean, sample standard deviation, and sample size are given. Use the one-mean t-test to…
A:
Q: Calculate SS, σ², and standard deviation for the following population of N = 5 scores: 6, 0, 4, 2, 3
A:
Q: Listed below are amounts (in millions of dollars) collected from parking meters by a security…
A: According to the given information in this question We need to find means for security company and…
Q: Cursive Writing An article in the October 11, 2006, issue of the Washington Post claimed that 15% of…
A: Given data p=15% E=0.05 confidence interval=99%
Q: A sales manager for an advertising agency believes there is a relationship between the number of…
A: Slope is the changing variable in the regression equation. It is also known as regression…
Q: A company claims that the mean monthly residential electricity consumption in a certain region is…
A:
Q: s 30 (which means that the value of Which of the following would be the chart? ne p-control…
A: Given: Sample proportion of defective product p^= 0.03 Sample size n= 30 To find standard…
Q: Find the (a) mean, (b) median, (c) mode, and (d) midrange for the data and then (e) answer the given…
A:
Q: A company claims that the mean monthly residential electricity consumption in a certain region is…
A: Given that, A company claims that the mean monthly residential electricity consumption in a certain…
Q: Assume that a local garment manufacturer has 2,700 employees. manager then decides to obtain the…
A: Employees in a Local garment manufacturing Unit - 2700 The manager chooses a sample of 300…
Q: Question 1 Suppose a waitress keeps track of her tips, as a percentage of the bill, for a random…
A: GivenMean(μ)=14%standard deviation(σ)=3%sample size(n)=60
Q: Use the value of the linear correlation coefficient to calculate the coefficient of determination.…
A: The given linear correlation coefficient r is -0.338.
Q: The number of credits being taken by a sample of 13 full-time college students are listed below.…
A: Given that Data : 5 7 8 8 5 6 4 4 4 4 4 4 5 We have to find mean, median and mode of data
Q: (a) State the null hypothesis Ho and the alternative hypothesis H₁. Ho: 0 H₁:0 (b) Determine the…
A: Given: Sample size, n is 8 Brand 1 Brand 2 Difference 0.43 0.43 0 0.62 0.48 0.14 0.35 0.2…
Q: In a game of chance, a player has 3 tries to get a '6' on the dice roll. If he succeeds directly, he…
A: Given: Number of tries (n) = 3 Probability of appearing 6 (p) = 16 Amount of bet = 3 Amount earned…
Q: State whether the standardized test statistic t indicates that you should reject the null…
A: Given data The rejection region is t>1.845
Q: Out of 1000 residents of Eagle County surveyed, 590 of them feel that their children receive a good…
A: There are two independent samples which are Eagle County and Beaver County. We have to construct 95%…
Q: 9.53
A: There are two types of variables generally. They are independent and dependent variable. Independent…
Q: Consider the following set of ordered pairs. Complete parts a through c. 2 5 1 X y 55 34 3 57 3 33 3…
A: We have the set of ordered pairs as follows: x 2 5 3 5 3 y 1 5 4 7 3
Q: Find the critical value(s) and rejection region(s) for the indicated t-test, level of significance…
A: Given that α = 0.10 , n = 17 , Two-tailed test

Step by step
Solved in 2 steps

- Globally, 35% of all ridged brittleshell tortoises have spots on their shells. A herpetologist in Citition collects a sample of 38 ridged brittlesell tortoises and finds that 16 of them have spots on their shells. The herpetologist would like to test the claim that the proportion of ridged brittleshell tortoises in Cititon with spots on their shells is greater than 35%. The herpetologist ends up rejecting the null hypothesis. If the actual proportion of ridged brittleshell tortoises in Cititon with spots on their shells is 41%, then what type of error, if any, has occurred? In the problem above, what is the test statistic?Suppose that 80% of 3–4-year-old children and 70% of5–8-year-old children in a village are vaccinated with QIVvaccine. Also assume that children who are not vaccinatedhave twice the incidence of influenza as the control groupin Table 3.7.3.29 What % of 3–4-year-old children in the village will getinfluenza?3.30 What % of 5–8-year-old children in the village will getinfluenza?3.31 Suppose we identify a 5–8-year-old child with influenzain the village but are uncertain whether the childwas vaccinated. If we make the same assumptions as inProblems 3.29–3.30, then what is the probability that thechild was vaccinated? (Hint: Use Bayes’ rule here.)A researcher wonders if there an association between the incidence of colds and the amount of vitamin C taken. He recruits 98 volunteers and randomly assigns 29 of them to take 500 mg of vitamin C, 17 of them to take 1000 mg of vitamin C and the rest to take no vitamin C. At the end of the study, it was determined that 28 of the volunteers did not have any colds where 12 of them were in the 500 mg group and 8 of them were in the 1000 mg group. Test the appropriate hypothesis at α=.01 Complete the table of expected counts under the null hypothesis. At least one cold No colds No vitamin C 14.857 500 mg vitamin C 20.714 1000 mg vitamin C 12.143 4.857
- A survey of states found that the proportions of achults who are smokers in Alabama was 24.8% and in Missouri it was 23.4%Both samples had 2000 people. At alpha = 0.01 the researchers claim that the proportion of adults who are smokers is greater in Alabama than in Missouri What is the correct set of hypotheses for this scenario ?A researcher wonders if there an association between the incidence of colds and the amount of vitamin C taken. He recruits 86 volunteers and randomly assigns 25 of them to take 500 mg of vitamin C, 19 of them to take 1000 mg of vitamin C and the rest to take no vitamin C. At the end of the study, it was determined that 26 of the volunteers did not have any colds where 12 of them were in the 500 mg group and 9 of them were in the 1000 mg group. Test the appropriate hypothesis at α=.05.α=.05. Round all answers to three decimal places. (a). H0:H0: There Select an answer is is not an association between the incidence of colds and the amount of vitamin C taken. (b). Ha:Ha: There Select an answer is is not an association between the incidence of colds and the amount of vitamin C taken. (c). Complete the table of expected counts under the null hypothesis. Hint At least one cold No colds No vitamin C 12.698 500 mg vitamin C 17.442 1000 mg vitamin C 13.256 5.744…A seven-year medical research study reported that women whose mothers took the drug DES during pregnancy were twice as likely to develop tissue abnormalities that might lead to cancer as were women whose mothers did not take the drug. a. This study compared two What were the populations? b. Do you suppose the data were obtained in a survey or an experiment? c. For the population of women whose mothers took the drug DES during pregnancy, a sample of 3980 women showed that 63 developed tissue abnormalities that might lead to Provide a descriptive statistic that could be used to estimate the number of women out of 1000 in this population who have tissue abnormalities. d. For the population of women whose mothers did not take the drug DES during pregnancy, what is the estimate of the number of women out of 1000 who would be expected to have tissue abnormalities? e. Medical studies often use a relatively large sample (in this case.3980).Why?
- A seven-year medical research study reported that women whose mothers took the drugDES during pregnancy were twice as likely to develop tissue abnormalities that might leadto cancer as were women whose mothers did not take the drug.a. This study compared two populations. What were the populations?b. Do you suppose the data were obtained in a survey or an experiment?c. For the population of women whose mothers took the drug DES during pregnancy, asample of 3980 women showed that 63 developed tissue abnormalities that might leadto cancer. Provide a descriptive statistic that could be used to estimate the number ofwomen out of 1000 in this population who have tissue abnormalities.d. For the population of women whose mothers did not take the drug DES duringpregnancy, what is the estimate of the number of women out of 1000 who would beexpected to have tissue abnormalities?A seven-year medical research study reported that women whose mothers took the drugDES during pregnancy were twice as likely to develop tissue abnormalities that might leadto cancer as were women whose mothers did not take the drug.a. This study compared two populations. What were the populations?b. Do you suppose the data were obtained in a survey or an experiment?c. For the population of women whose mothers took the drug DES during pregnancy, asample of 3980 women showed that 63 developed tissue abnormalities that might leadto cancer. Provide a descriptive statistic that could be used to estimate the number ofwomen out of 1000 in this population who have tissue abnormalities2. A leading researcher in the study of interstate highway accidents proposes that a major cause of many collisions on the interstates is not the speed of the vehicles but rather the difference in speeds of the vehicles. When some vehicles are traveling slowly while other vehicles are traveling at speeds greatly in excess of the speed limit, the faster-moving vehicles may have to change lanes quickly, which can increase the chance of an accident. Thus, when there is a large variation in the speeds of the vehicles in a given location on the interstate, there may be a larger number of accidents than when the traffic is moving at a more uniform speed. The researcher believes that when the standard deviation in speed of vehicles exceeds 10 mph, the rate of accidents is greatly increased. During a 1-hour period of time, a random sample of 50 vehicles is selected from a section of an interstate known to have a high rate of accidents, and their speeds are recorded using a radar gun. The data…
- Suppose a fertilizer company wants to test the effectiveness of a new fertilizer on its corn fields. The company divides a corn field into rectangular patches of the same area and randomly selects certain patches to which the fertilizer is applied and other patches to which no fertilizer is applied. The patches to which no fertilizer is applied serves as a *fill in the blank* for the experiment. (i) control (ii) placebo (iii) observation (iv) non-treatmentA graduate student realized that the depression study above in Question 4 should have had a placebo condition in which a third group was given a pill just as the people in the Drug condition were, but where the pill was not Drug D (e.g., a sugar pill). So she designed a new experiment with three conditions -- Drug, No Drug, and Placebo. To perform the experiment, the graduate student randomly assigned 18 people into the three groups so that each group has 6 people. After one month of treatment, all 18 people were asked to rate on a scale from 1 to 7 how depressed they felt, where 1 = not depressed at all and 7 = very depressed. The following are the data: Drug No Drug Placebo 2 4 5 3 5 5 4 5 6 4 4 5 2 6 4 3 6 5 nD = 6 nND = 6 nplacebo = 6 MD = 3 MND = 5 Mplacebo = 5 Using an α-level of .05, perform an…The National Institute of Mental Health published an article stating that in any two-year period, approximately 10.5percent of American adults suffer from depression or a depressive illness. Suppose that in a survey of 150 people in a certain town, eight of them suffered from depression or a depressive illness. If you were conducting a hypothesis test to determine if the true proportion of people in that town suffering from depression or a depressive illness is lower than the percent in the general adult American population, what would the null and alternative hypotheses be?