Find the critical value(s) and rejection region(s) for the indicated t-test, level of significance a, and sample size n. Two-tailed test, a = 0.10, n = 17 Click the icon to view the t-distribution table. The critical value(s) is/are (Round to the nearest thousandth as needed. Use a comma to separate answers as needed.) Determine the rejection region(s). Select the correct choice below and fill in the answer box(es) within your choice. (Round to the nearest thousandth as needed.) OA. 1< O C. and t>
Find the critical value(s) and rejection region(s) for the indicated t-test, level of significance a, and sample size n. Two-tailed test, a = 0.10, n = 17 Click the icon to view the t-distribution table. The critical value(s) is/are (Round to the nearest thousandth as needed. Use a comma to separate answers as needed.) Determine the rejection region(s). Select the correct choice below and fill in the answer box(es) within your choice. (Round to the nearest thousandth as needed.) OA. 1< O C. and t>

MATLAB: An Introduction with Applications
6th Edition
ISBN:9781119256830
Author:Amos Gilat
Publisher:Amos Gilat
Chapter1: Starting With Matlab
Section: Chapter Questions
Problem 1P

Related questions
Question
Transcribed Image Text:K
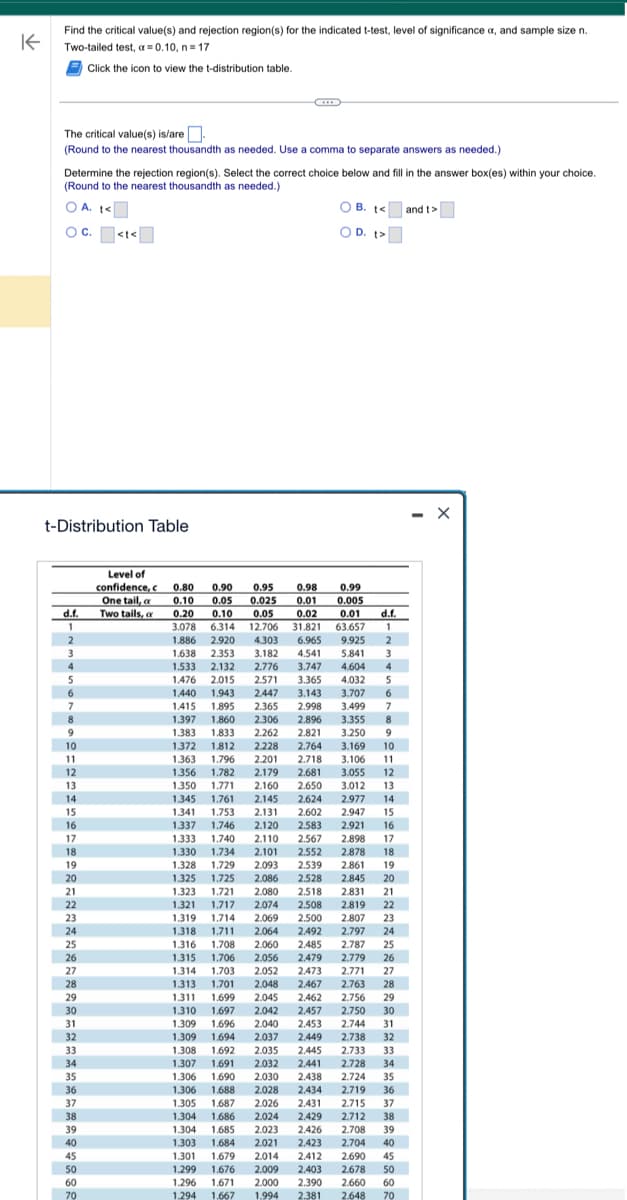
Find the critical value(s) and rejection region(s) for the indicated t-test, level of significance a, and sample size n.
Two-tailed test, a=0.10, n=17
Click the icon to view the t-distribution table.
The critical value(s) is/are.
(Round to the nearest thousandth as needed. Use a comma to separate answers as needed.).
Determine the rejection region(s). Select the correct choice below and fill in the answer box(es) within your choice.
(Round to the nearest thousandth as needed.)
OA. t<
OC.<t<
t-Distribution Table
d.f.
1
2
3
4
5
6
7
8
9
10
11
12
13
14
15
16
17
18
19
20
21
22
23
24
25
26
27
28
29
30
31
32
33
34
35
36
37
38
39
40
45
50
60
70
Level of
confidence, c 0.80 0.90 0.95 0.98
One tail, a
0.05 0.025 0.01
0.10 0.05 0.02
Two tails, a
OB. t< and t>
OD. t>
0.99
0.005
0.01
d.f.
63.657
3.169 10
0.10
0.20
3.078 6.314 12.706 31.821
1
1.886 2.920 4.303 6.965 9.925 2
1.638 2.353 3.182 4.541 5.841 3
1.533 2.132 2.776 3.747 4.604 4
1.476 2.015 2.571 3.365 4.032 5
1.440 1.943 2,447 3.143 3.707 6
1.415 1.895 2.365 2.998 3.499 7
1.397 1.860 2.306 2.896 3.355 8
1.383
1.833 2.262 2.821 3.250 9
1.372 1.812 2.228 2.764
1.363 1,796 2.201 2.718 3.106 11
1.356 1.782 2.179 2.681 3.055 12
1.350 1,771 2.160 2.650 3.012 13
1.345 1,761 2.145 2.624 2.977 14
1.341
1.753 2.131 2.602 2.947 15
1.337 1.746 2.120 2.583 2.921 16
1.333 1.740 2.110 2.567 2.898 17
1.330 1.734 2.101 2.552 2.878 18
1.328 1.729 2.093 2.539 2.861 19
1.325 1.725 2.086 2.528 2.845 20
1.323 1.721 2.080 2.518 2.831 21
1.321 1.717 2.074 2.508 2.819 22
1.319 1,714 2.069 2.500 2.807 23
1.318 1,711 2.064 2.492 2.797 24
1.316 1.708 2,060 2.485 2.787 25
1.315 1.706 2.056 2.479 2.779 26
1.314 1.703 2.052 2.473 2.771 27
1.313 1.701 2.048 2.467 2.763 28
1.311 1.699 2,045 2.462 2.756 29
1.310 1.697 2.042 2.457
2.750
30
1.309 1.696 2.040 2.453 2.744 31
1.309 1.694
2.037 2.449 2.738 32
1.308 1.692 2.035 2.445
2.733
33
1.307 1.691 2.032 2.441 2.728 34
1.306 1.690 2.030 2.438 2.724 35
1.306 1.688
2.028 2.434 2.719 36
1.305 1.687 2.026 2.431 2.715 37
1.304 1.686 2.024 2.429 2.712 38
1.304 1.685 2.023 2.426 2.708 39
1.303 1.684 2.021 2.423 2.704 40
1.301 1.679 2.014 2,412 2.690 45
1.299 1.676 2.009 2.403 2.678 50
1.296 1.671 2.000 2.390 2.660 60
1.294 1.667
1.994 2.381 2.648 70
X
Expert Solution
This question has been solved!
Explore an expertly crafted, step-by-step solution for a thorough understanding of key concepts.

Step by step
Solved in 2 steps with 1 images

Recommended textbooks for you
MATLAB: An Introduction with Applications
Statistics
ISBN:
9781119256830
Author:
Amos Gilat
Publisher:
John Wiley & Sons Inc

Probability and Statistics for Engineering and th…
Statistics
ISBN:
9781305251809
Author:
Jay L. Devore
Publisher:
Cengage Learning

Statistics for The Behavioral Sciences (MindTap C…
Statistics
ISBN:
9781305504912
Author:
Frederick J Gravetter, Larry B. Wallnau
Publisher:
Cengage Learning
MATLAB: An Introduction with Applications
Statistics
ISBN:
9781119256830
Author:
Amos Gilat
Publisher:
John Wiley & Sons Inc
Probability and Statistics for Engineering and th…
Statistics
ISBN:
9781305251809
Author:
Jay L. Devore
Publisher:
Cengage Learning
Statistics for The Behavioral Sciences (MindTap C…
Statistics
ISBN:
9781305504912
Author:
Frederick J Gravetter, Larry B. Wallnau
Publisher:
Cengage Learning

Elementary Statistics: Picturing the World (7th E…
Statistics
ISBN:
9780134683416
Author:
Ron Larson, Betsy Farber
Publisher:
PEARSON

The Basic Practice of Statistics
Statistics
ISBN:
9781319042578
Author:
David S. Moore, William I. Notz, Michael A. Fligner
Publisher:
W. H. Freeman

Introduction to the Practice of Statistics
Statistics
ISBN:
9781319013387
Author:
David S. Moore, George P. McCabe, Bruce A. Craig
Publisher:
W. H. Freeman