10:48 イ Vo) 4G LTÉ 1 TUTORIAL 1.pdf

Algebra & Trigonometry with Analytic Geometry
13th Edition
ISBN:9781133382119
Author:Swokowski
Publisher:Swokowski
Chapter6: The Trigonometric Functions
Section6.4: Values Of The Trigonometric Functions
Problem 23E

Related questions
Topic Video
Question
Transcribed Image Text:10:48 O
Vo)) 4G
TUTORIAL 1.pdf
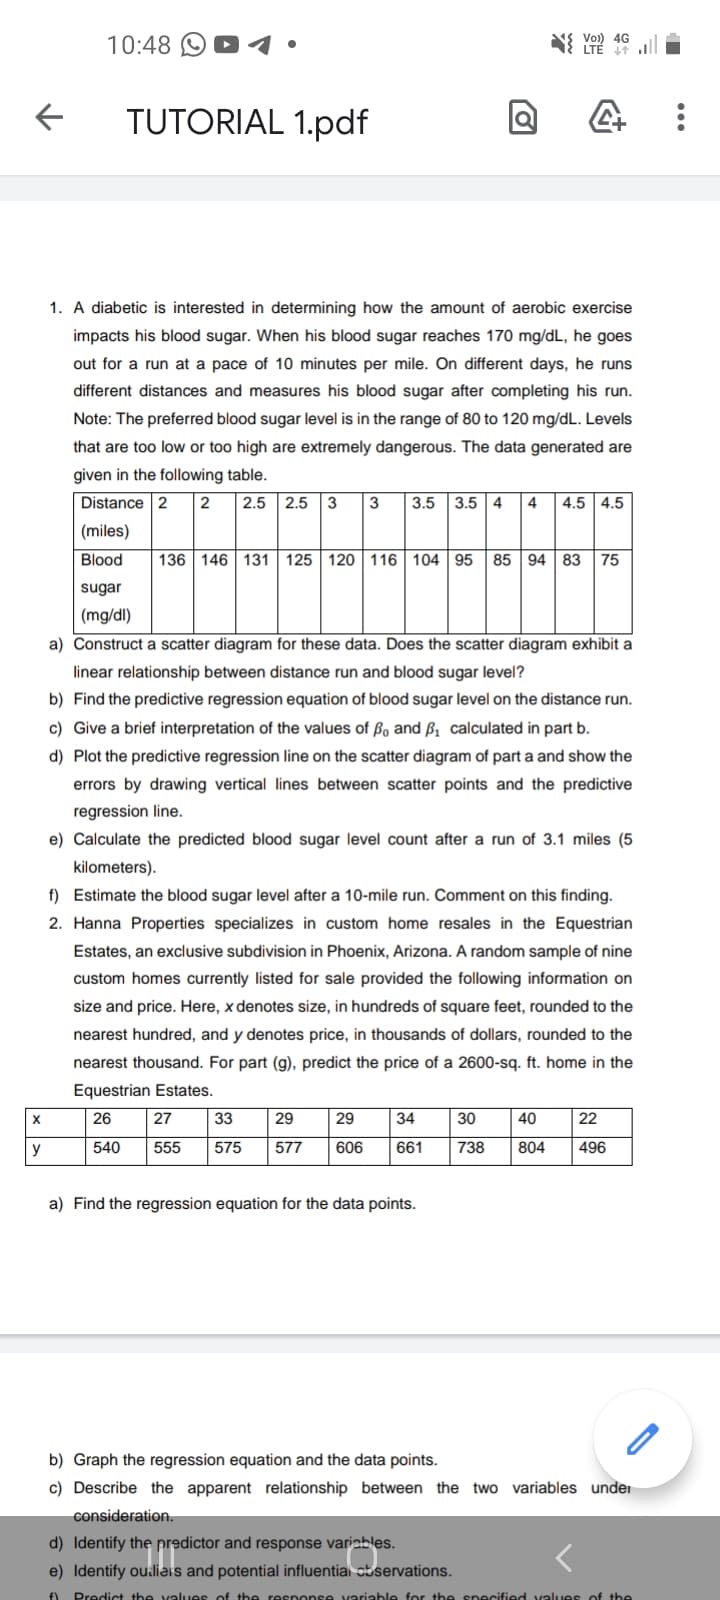
1. A diabetic is interested in determining how the amount of aerobic exercise
impacts his blood sugar. When his blood sugar reaches 170 mg/dL, he goes
out for a run at a pace of 10 minutes per mile. On different days, he runs
different distances and measures his blood sugar after completing his run.
Note: The preferred blood sugar level is in the range of 80 to 120 mg/dL. Levels
that are too low or too high are extremely dangerous. The data generated are
given in the following table.
Distance 2
2
|2.5
2.5
3
3
3.5
3.5 4
4
4.5 4.5
(miles)
Blood
136 146 131 125 120 116 104 95
85 94 83| 75
sugar
(mg/dl)
a) Construct a scatter diagram for these data. Does the scatter diagram exhibit a
linear relationship between distance run and blood sugar level?
b) Find the predictive regression equation of blood sugar level on the distance run.
c) Give a brief interpretation of the values of ßo and ß, calculated in part b.
d) Plot the predictive regression line on the scatter diagram of part a and show the
errors by drawing vertical lines between scatter points and the predictive
regression line.
e) Calculate the predicted blood sugar level count after a run of 3.1 miles (5
kilometers).
f) Estimate the blood sugar level after a 10-mile run. Comment on this finding.
2. Hanna Properties specializes in custom home resales in the Equestrian
Estates, an exclusive subdivision in Phoenix, Arizona. A random sample of nine
custom homes currently listed for sale provided the following information on
size and price. Here, x denotes size, in hundreds of square feet, rounded to the
nearest hundred, and y denotes price, in thousands of dollars, rounded to the
nearest thousand. For part (g), predict the price of a 2600-sq. ft. home in the
Equestrian Estates.
X
26
27
33
29
29
34
30
40
22
y
540
555
575
577
606
661
738
804
496
a) Find the regression equation for the data points.
b) Graph the regression equation and the data points.
c) Describe the apparent relationship between the two variables under
consideration.
d) Identify the predictor and response variables.
e) Identify ouiliars and potential influential ctservations.
f)
Predict the values of the response variable for tbe specified values of the
Expert Solution
This question has been solved!
Explore an expertly crafted, step-by-step solution for a thorough understanding of key concepts.

Step by step
Solved in 2 steps with 1 images

Knowledge Booster


Learn more about
Need a deep-dive on the concept behind this application? Look no further. Learn more about this topic, statistics and related others by exploring similar questions and additional content below.Recommended textbooks for you
Algebra & Trigonometry with Analytic Geometry
Algebra
ISBN:
9781133382119
Author:
Swokowski
Publisher:
Cengage
Algebra & Trigonometry with Analytic Geometry
Algebra
ISBN:
9781133382119
Author:
Swokowski
Publisher:
Cengage