In a study of hypnotic suggestion, 16 male volunteers were randomly allocated to a treatment group and a control group. Each subject participated in a two-phase experimental session. In the first phase, respiration was measured while the subject was awake and at rest. In the second phase, the subject was told to imagine that he was performing muscular work, and respiration was measured again. For subjects in the treatment group, hypnosis was induced between the first and second phases; thus, the suggestion to imagine muscular work was “hypnotic suggestion” for treatment subjects and “waking suggestion” for control subjects. The table below shows the measurements of total ventilation (liters of air per minute per square meter of body area) for all 16 subjects. (a) For those being hypnotized (treatment group), test the hypotheses H0: μrest = μwork versus Ha: μrest 6= μwork, where μrest and μwork are respectively the mean total ventilation when they are at rest and when they are performing imaginary muscular work. Please report the test statistic with degrees of freedom, and (a range for) the P-value. What do you conclude at 0.05 significance level? (b) Construct a 95% confidence interval for the mean difference μwork −μrest in their total ventilation when the subjects are at rest and when performing imaginary muscular work if hypnosis is induced between the two phases. (c) Test whether hypnosis (treatment) induced a greater change in in total ventilation than no hypnosis (control). That is, test the hypotheses H0 : μtrt, work −μtrt, rest = μctrl,work −μctrl,rest Ha : μtrt, work −μtrt, rest > μctrl,work −μctrl,rest where μtrt, work−μtrt, rest is the mean change in total ventilation at work v.s. at rest for the hypnotized (treatment) group, and μctrl,work −μctrl,rest is the corresponding change for the control group. Please report the test statistic with degrees of freedom, and give (a range for) the P-value. Did hypnosis induce a significantly higher change in total ventilation at 0.05 level? Hint: Should you conduct a two-sample t-test or a paired t-test?


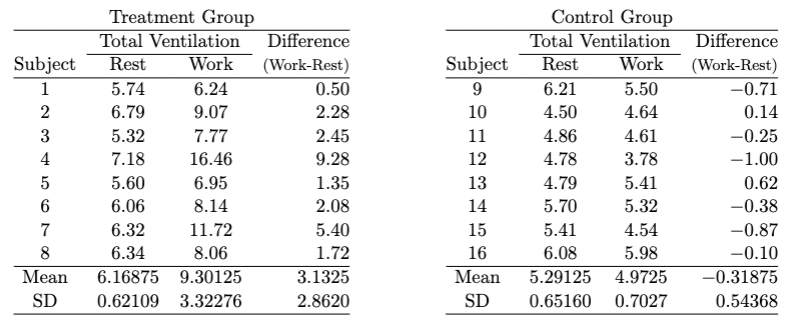
In a study of hypnotic suggestion, 16 male volunteers were randomly allocated to a treatment group
and a control group. Each subject participated in a two-phase experimental session. In the first phase, respiration was measured while the subject was awake and at rest. In the second phase, the subject was told to imagine that he was performing muscular work, and respiration was measured again. For subjects in the treatment group, hypnosis was induced between the first and second phases; thus, the suggestion to imagine muscular work was “hypnotic suggestion” for treatment subjects and “waking suggestion” for control subjects. The table below shows the measurements of total ventilation (liters of air per minute per square meter of body area) for all 16 subjects.
(a) For those being hypnotized (treatment group), test the hypotheses H0: μrest = μwork versus Ha:
μrest 6= μwork, where μrest and μwork are respectively the mean total ventilation when they are at
rest and when they are performing imaginary muscular work. Please report the test statistic with
degrees of freedom, and (a
(b) Construct a 95% confidence interval for the mean difference μwork −μrest in their total ventilation
when the subjects are at rest and when performing imaginary muscular work if hypnosis is induced
between the two phases.
(c) Test whether hypnosis (treatment) induced a greater change in in total ventilation than no hypnosis
(control). That is, test the hypotheses
H0 : μtrt, work −μtrt, rest = μctrl,work −μctrl,rest
Ha : μtrt, work −μtrt, rest > μctrl,work −μctrl,rest
where μtrt, work−μtrt, rest is the mean change in total ventilation at work v.s. at rest for the hypnotized (treatment) group, and μctrl,work −μctrl,rest is the corresponding change for the control group. Please report the test statistic with degrees of freedom, and give (a range for) the P-value. Did hypnosis induce a significantly higher change in total ventilation at 0.05 level? Hint: Should you conduct a two-sample t-test or a paired t-test?


Trending now
This is a popular solution!

Step by step
Solved in 3 steps with 1 images
