11) In a new auto study among 14 drivers living on one particular street, it was determined that 3 were involved in a car accident last year. If 14 drivers are randomly selected, what is the probability of getting 3 or more who were involved in a car accident last year? B) 0.604 D) 0.906 A) 0.393 C) 0.094 12) The probability that a house in an urban area will develop a leak is 5%. If 20 houses are randomly selected, what is the mean of the number of houses that developed leaks? (Special formula) A) 0.5 B) 1.5 C) 1 D) 2 13) A quiz consists of 620 true or false questions. If the student guesses on each question, what is the standard deviation of the number of correct answers, approximatelly? (Special formula) A) 17.6068169 C) 12.4498996 B) 2 D) 0
11) In a new auto study among 14 drivers living on one particular street, it was determined that 3 were involved in a car accident last year. If 14 drivers are randomly selected, what is the probability of getting 3 or more who were involved in a car accident last year? B) 0.604 D) 0.906 A) 0.393 C) 0.094 12) The probability that a house in an urban area will develop a leak is 5%. If 20 houses are randomly selected, what is the mean of the number of houses that developed leaks? (Special formula) A) 0.5 B) 1.5 C) 1 D) 2 13) A quiz consists of 620 true or false questions. If the student guesses on each question, what is the standard deviation of the number of correct answers, approximatelly? (Special formula) A) 17.6068169 C) 12.4498996 B) 2 D) 0

Chapter8: Sequences, Series,and Probability
Section8.7: Probability
Problem 4ECP: Show that the probability of drawing a club at random from a standard deck of 52 playing cards is...

Related questions

Concept explainers
Contingency Table
A contingency table can be defined as the visual representation of the relationship between two or more categorical variables that can be evaluated and registered. It is a categorical version of the scatterplot, which is used to investigate the linear relationship between two variables. A contingency table is indeed a type of frequency distribution table that displays two variables at the same time.
Binomial Distribution
Binomial is an algebraic expression of the sum or the difference of two terms. Before knowing about binomial distribution, we must know about the binomial theorem.
Topic Video
Question
11,12,13
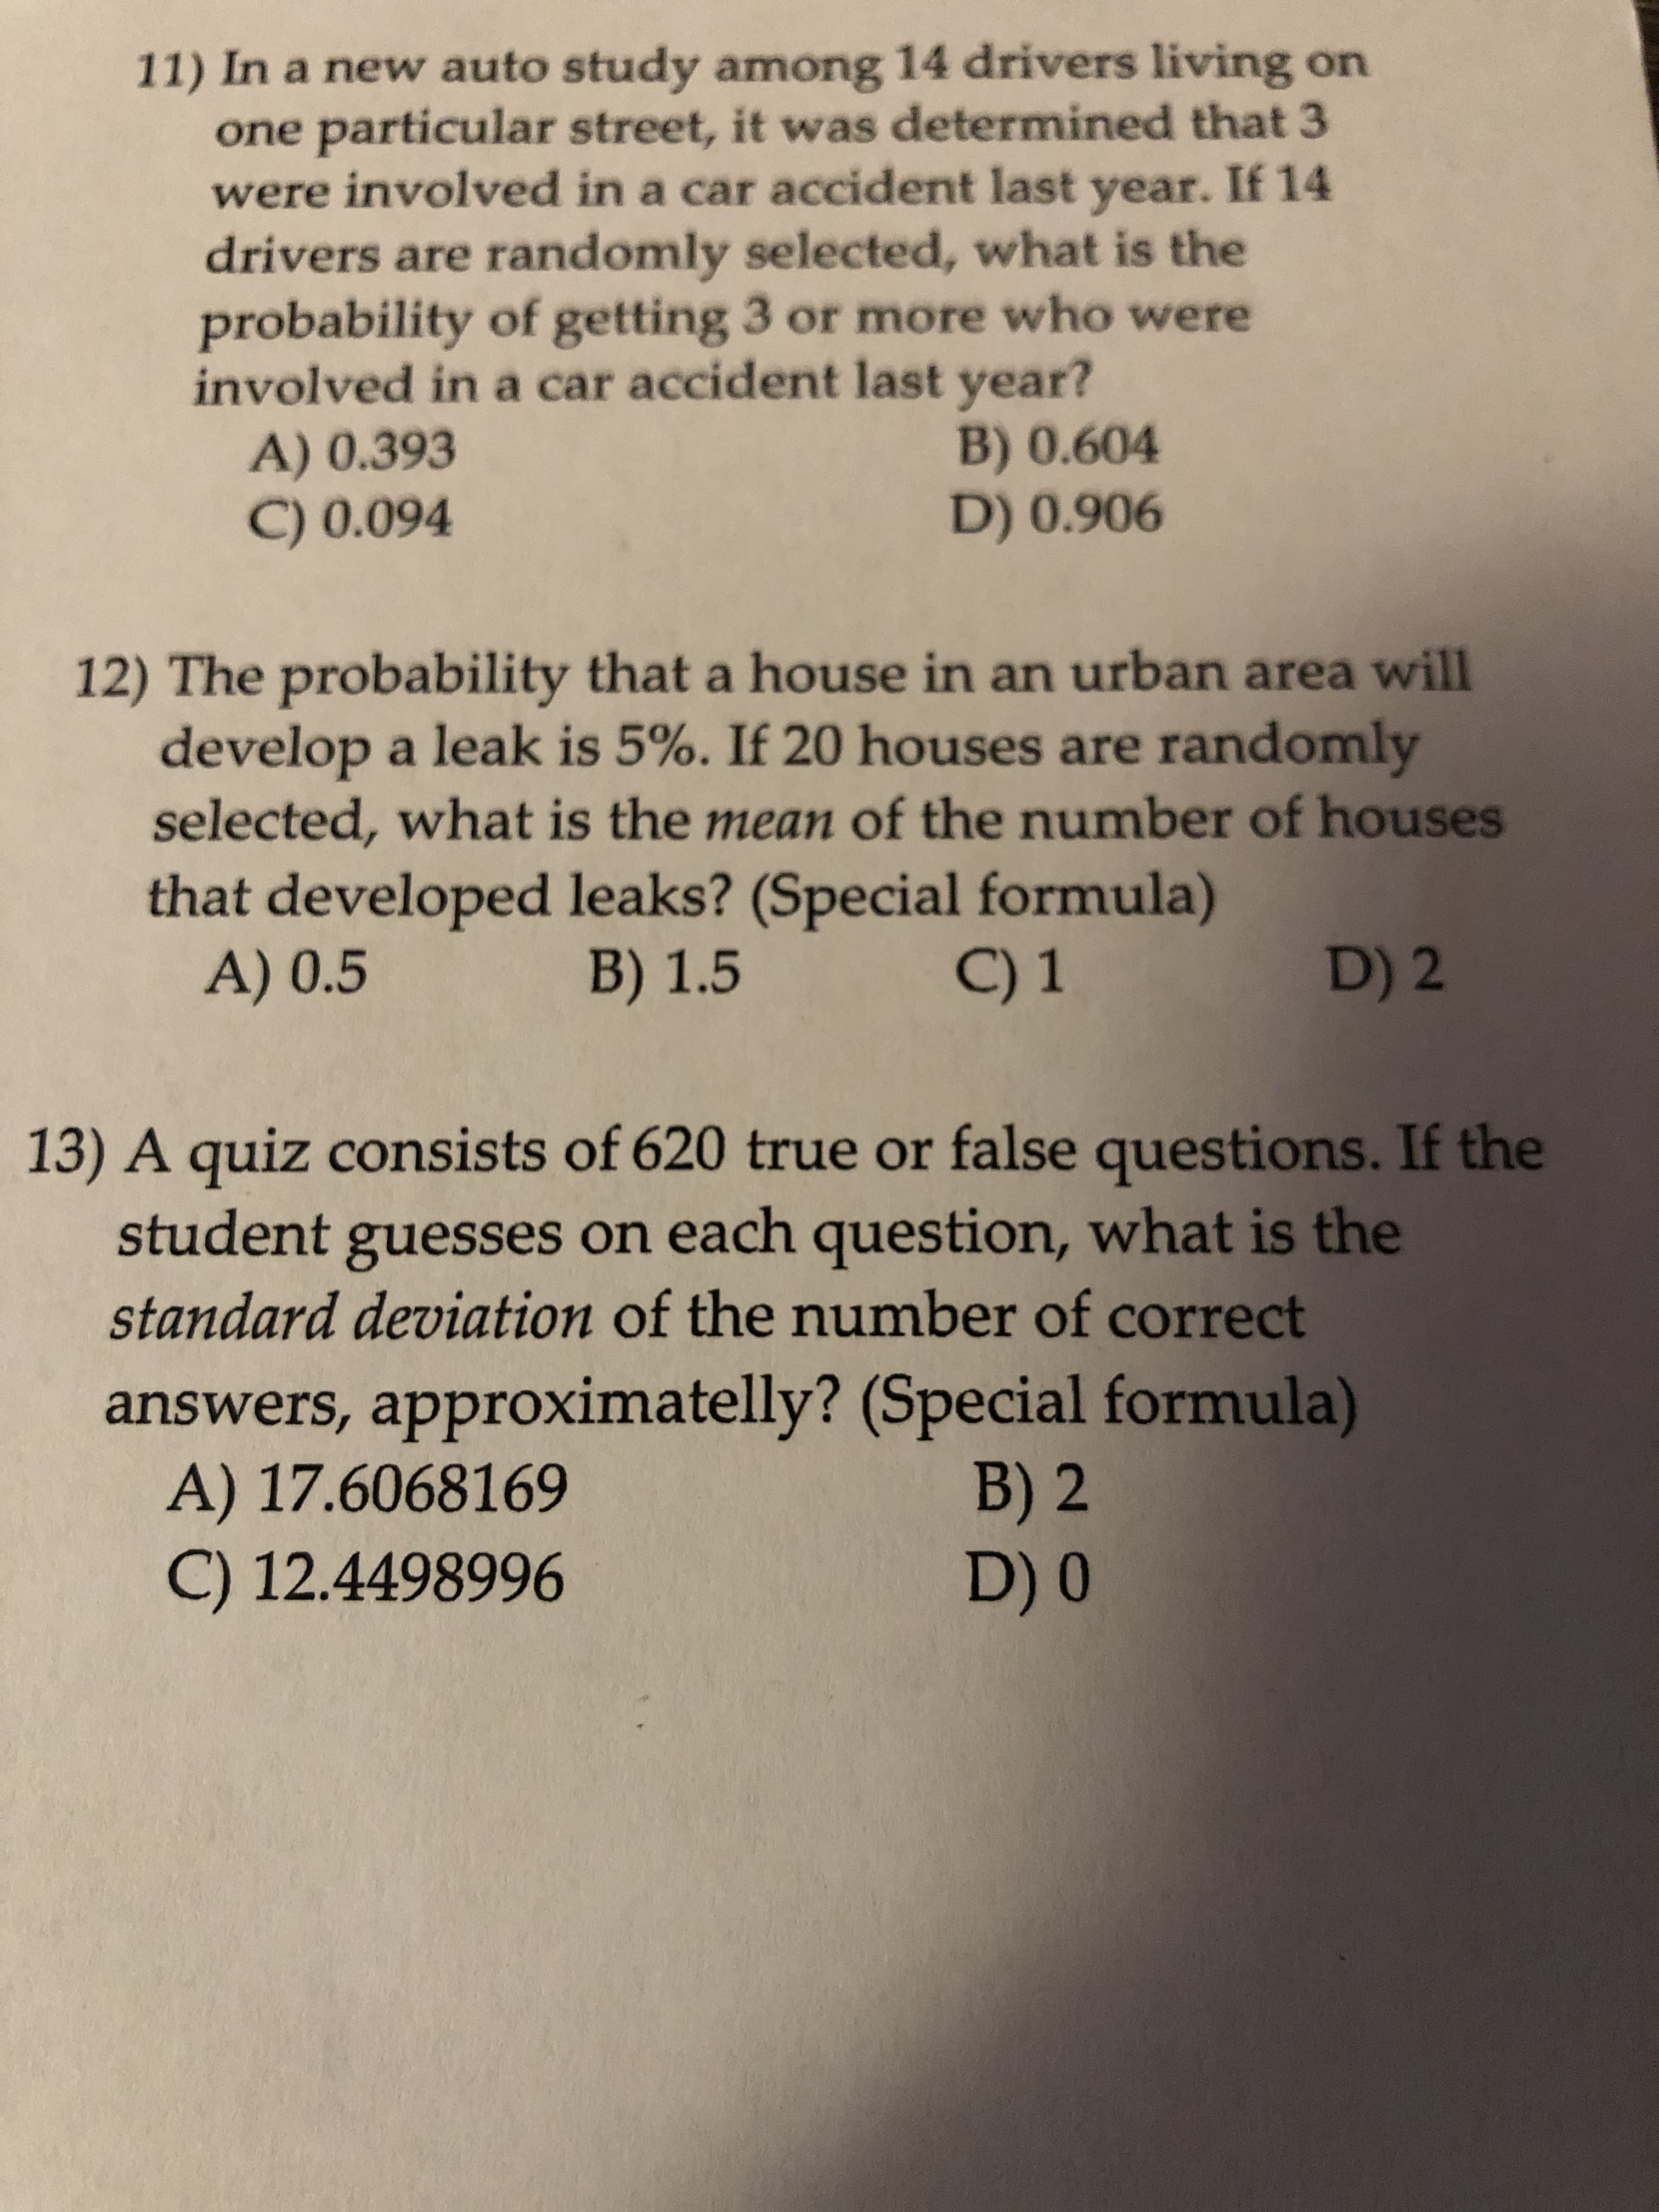
Transcribed Image Text:11) In a new auto study among 14 drivers living on
one particular street, it was determined that 3
were involved in a car accident last year. If 14
drivers are randomly selected, what is the
probability of getting 3 or more who were
involved in a car accident last year?
B) 0.604
D) 0.906
A) 0.393
C) 0.094
12) The probability that a house in an urban area will
develop a leak is 5%. If 20 houses are randomly
selected, what is the mean of the number of houses
that developed leaks? (Special formula)
A) 0.5
B) 1.5
C) 1
D) 2
13) A quiz consists of 620 true or false questions. If the
student guesses on each question, what is the
standard deviation of the number of correct
answers, approximatelly? (Special formula)
A) 17.6068169
C) 12.4498996
B) 2
D) 0
Expert Solution
This question has been solved!
Explore an expertly crafted, step-by-step solution for a thorough understanding of key concepts.

This is a popular solution!

Trending now
This is a popular solution!

Step by step
Solved in 2 steps with 3 images

Knowledge Booster


Learn more about
Need a deep-dive on the concept behind this application? Look no further. Learn more about this topic, statistics and related others by exploring similar questions and additional content below.Recommended textbooks for you