Among 27- to 32-year-olds, 33% say they have driven while under the influence of alcohol. Suppose that seven 27- to 32-year-olds are selected at random. (d) What is the probability that at least one has driven while under the influence of alcohol?


Contingency Table
A contingency table can be defined as the visual representation of the relationship between two or more categorical variables that can be evaluated and registered. It is a categorical version of the scatterplot, which is used to investigate the linear relationship between two variables. A contingency table is indeed a type of frequency distribution table that displays two variables at the same time.
Binomial Distribution
Binomial is an algebraic expression of the sum or the difference of two terms. Before knowing about binomial distribution, we must know about the binomial theorem.
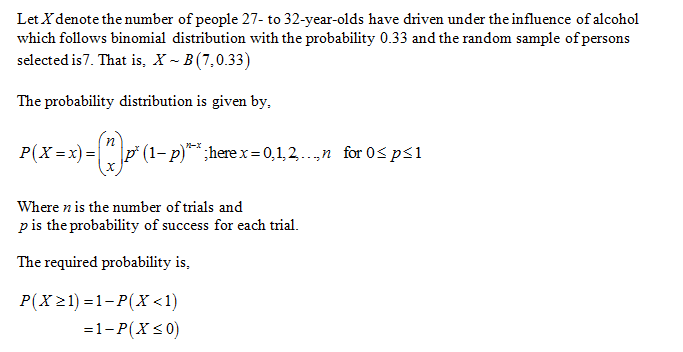
Among 27- to 32-year-olds, 33% say they have driven while under the
influence of alcohol. Suppose that seven 27- to 32-year-olds are selected at random.
(d) What is the probability that at least one has driven while under the influence of alcohol?
(d)
Obtain the probability that at least one has driven while under the influence of alcohol.
The probability that at least one has driven while under the influence of alcohol is obtained below as follows:

Trending now
This is a popular solution!

Step by step
Solved in 2 steps with 2 images


