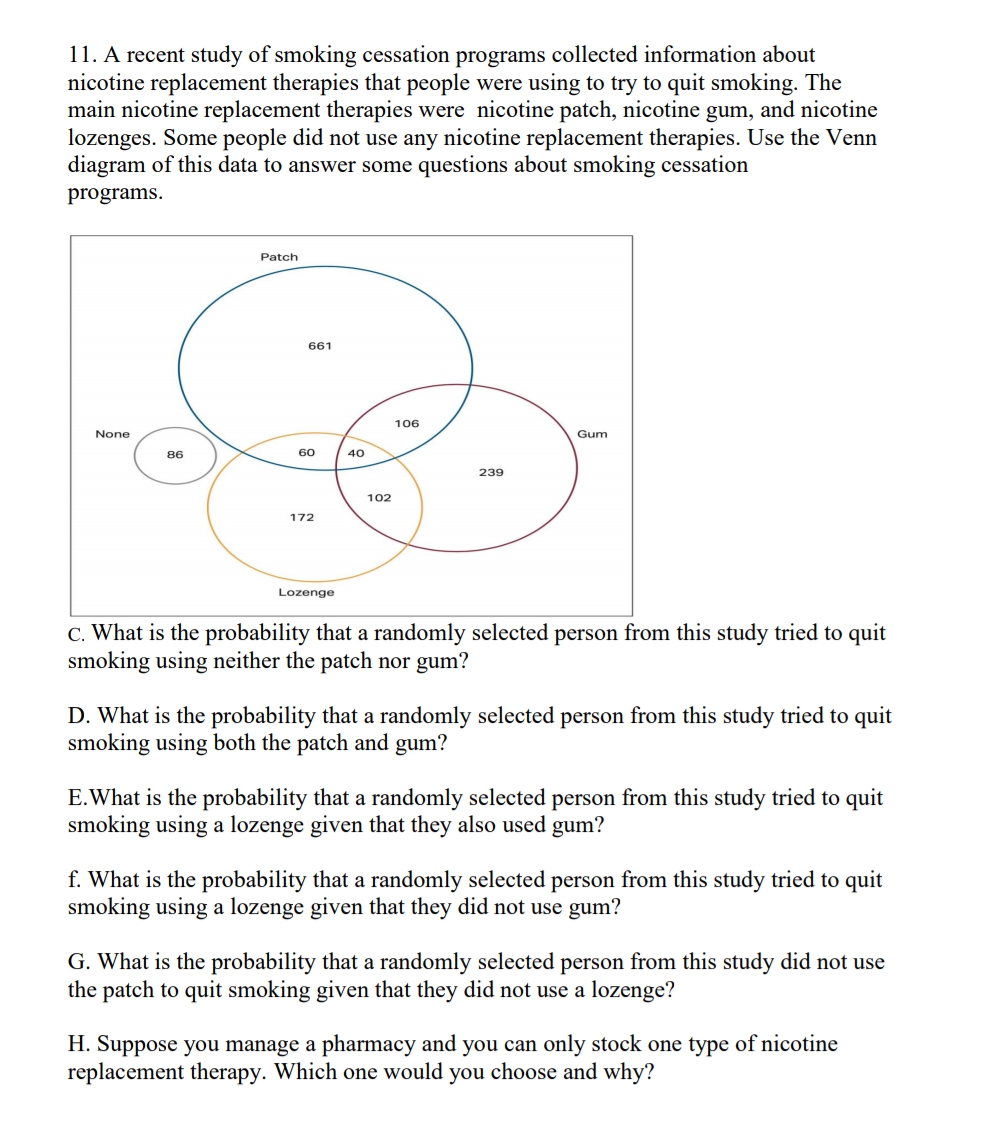
11. A recent study of smoking cessation programs collected information about nicotine replacement therapies that people were using to try to quit smoking. The main nicotine replacement therapies were nicotine patch, nicotine gum, and nicotine lozenges. Some people did not use any nicotine replacement therapies. Use the Venn diagram of this data to answer some questions about smoking cessation programs. Patch
Q: Determine the sample mean and sample standard deviation based on the confidence interval for the…
A: a) The sample mean is, The value of margin of error is, The degree of freedom is, df=n-1 =13-1…
Q: Question 5US e Derive a model which can be used to predict the maximum fee that they would be…
A: Given information: Age # of times they shop Max fee 47 4 0 63 2 0 42 3 0 21 2 5 27 4 10…
Q: You are the new controller for Moonlight Bay Resorts. The company CFO has asked you to determine the…
A:
Q: As the biologist for a certain crocodile farm, you know that its carrying capacity is 20,000…
A: Given A0=5000t=6 weeksA=7500 Find a and b parts
Q: The standard error for the difference between the two means is A) 9.19 B)4 C)2.0 D)3.91
A:
Q: 3. The tinal grades of a student in six subjects are as follows: Pinal Grade Subject Philosophy…
A:
Q: When the relationship between two variables is the residuals are because data points are closer to…
A: We need to fill the blanks with correct option of given statement: When the relationship between…
Q: What's the probability that bad credit customer does not receive a loan (sensitivity ot power of a…
A:
Q: Sampling 4 pieces of precision-cut wire (to be used in computer assembly) every hour for the past 24…
A: Control limits for x-bar chart: Consider,
Q: An investigator wants to assess whether smoking is a risk factor for bladder cancer. Electronic…
A: Aim is, to access whether smoking is a risk factor for bladder cancer. 100 cases with pancreatic…
Q: A psychologist would like to examine the effects of caffeine consumption on the activity level of…
A: The F - score formula in the ANOVA test is given by F-score=SSbetweenK-1SSerrorN-K Where,…
Q: The player played a total of 670 games in 10 seasons and averaged 9.23 assists in these games. If…
A: The probability mass function of the Poisson distribution is given as follows:
Q: you're a data analyst for an insurance company. You want to make sure that your employer is not…
A: There are two independent samples which are Bubba and Merle. We have to test whether prices are…
Q: Your crazy uncle has built a panic room in his basement. The panic room can only be accessed by…
A: Given information: The code uses only the digits 0, 1, 2, ... , 6 and is 8 digits long. The numeric…
Q: Suppose X1,X2,...,Xn is a random sample from a binomial distribution. Recall X is the number of…
A: Since you have posted a question with multiple sub-parts, we will solve first three subparts for…
Q: A small-business Web site contains 100 pages and 60%, 30%, and 10% of the pages contain low,…
A: f(x,y) is the joint p.d.f. of x and y. N= 100. A sample of size 4 has been selected. n= 4 So the…
Q: Approximately 10%10% of Americans are left-handed (we will treat this as a known population…
A: From the provided information, Sample size (n) = 105 From which 16 were left-handed.
Q: According the World Health Organization, the Body Mass Index (BMI=Weight in Kilograms/Height in…
A: For the given data Conduct a ----- tailed test
Q: The premium of a fully discrete 3-year endowment insurance of 1 on an individual (x) is
A: Given: qx = qx+1 = 0.15 So, px = px+1 = 0.85 Sum assured (S) = 1 Px:3=0.358
Q: are the different types of probability distribution? Define
A: There are two types of probability distribution as below: (a) Discrete probability distribution (b)…
Q: A cannabis business operates as follows. Let X, be the amount of cannabis in its inventory on the…
A:
Q: The claim is that weights (grams) of quarters made after 1964 have a mean equal to 5.670 g as…
A: Given that Sample size n =36 Population mean =5.670 Test statistic t =-3.334
Q: Recently, the number of airline companies that offer in-flight Wi-Fi service to passengers has…
A: Given that Sample size n =160 Favorable cases x =25 Sample proportion π^=x/n =25/160 =0.1563…
Q: The failure time of a certain component has a Weibull distribution with B = 4, 0 = 2000, and y =…
A:
Q: A sample of size n= 47 has sample mean x = 57.6 and sample standard deviation s 9.5. Part: 0/ 2 Part…
A:
Q: How many courses are you taking this semester?…
A: For the given data Perform t test for one sample
Q: In CSE230, there were 2 assignments this semester. The probabilities that you would NOT get full…
A: Probability is the chance of occurrence of an event.
Q: Given this formula 1 ARL, where B = SLCL NC41,dx 1-B
A: Given information, β=∫LCLUCLNμ1, sndx¯ UCL=0.2002 LCL=0.1918 mean=0.1985 s=0.001392 n=240…
Q: You may need to use the appropriate appendix table or technology to answer this question. Given are…
A: Hi! Thank you for the question, as per the honor code, we are allowed to answer three sub-parts at a…
Q: 1) To evaluate whether hot or cold weather associated with increased suicide rates
A: Since, it is not mentioned which question to be answered, we're answering the first question. Please…
Q: The lengths of lumber a machine cuts are normally distributed with a mean of 100 inches and a…
A:
Q: Show that if X,, X,... is a Markov chain, then it is sta second-order probability masses: P{X, = X.…
A: Markov chains are used for the study of temporal and sequence data to interpret the dependencies and…
Q: Use the t-distribution to find a confidence interval for a difference in means -given the relevant…
A:
Q: Find the predicted value of the number of deaths for the mean values of the independent variables. I…
A: Multiple regression Multiple regression generally explains the relationship between multiple…
Q: The Minitab output shown below was obtained by using paired data consisting of weights (in Ib) of 27…
A:
Q: 9.3-15. Ledolter and Hogg (see References) report that an operator of a feedlot wants to compare the…
A: a) Null Hypothesis: H0: There is no difference among the mean weight gains due to the three…
Q: What is the probability that on a randomly selected day at least 6 fish will be caught if the…
A: Here mean = 4 fish per day
Q: The heart rate of 20 patients in the ICU have a mean of 95.3 beats per minute and a standard…
A: Given that n = 20 , μ = 95.3 , σ = 19.6
Q: Is B a Good Choice on a Multiple-Choice Exam? Multiple-choice questions on Advanced Placement exams…
A: From the provided information, Sample size (n) = 400 From which 90 questions having B as the answer.
Q: In the population of students at Milpitas High School, the proportion who are in the marching band…
A: Parameter : Parameter is the number that describes whole population. e.g : population mean (μ) ,…
Q: Nearly the entire dist irve) falls within 2 star
A: 1) 1. Nearly the entire distribution (about 99.7% of the area under the curve) falls within 2…
Q: An important issue in assessing nuclear energy is whether excess disease risks exist in the…
A: Please find the explanation below. Thank you
Q: The next 10 questions refer to the following scenario. The average student studies eight hours for a…
A: Given that
Q: It is a probability question In District A, 50% of children started primary school, and 70% of the…
A:
Q: 5. The length of similar components produced by a company are approximated by a normal distribution…
A:
Q: The following data lists the ages of a random selection of actresses when they won an award in the…
A: There are two dependent samples which are actress and actor. We have to test whether the difference…
Q: To compare the effectiveness of competing fertilizers on increasing radish size, researchers…
A: Dot plot is used to record simulated outcomes.
Q: A bank collected data of all its customers. Customers who repaid their consumer loans (Good Credit)…
A:
Q: EQUATION 2: 0, = 0.10 - 2.53(SIZE) + 1.64(AO) EQUATION 3: 0, = 175.12 + 0.005(SIZE.) + 0.549(AO)…
A: Regression evaluation, like most multivariate records, allows you to infer that there may be a…
Q: Solve the following: 1. Determine if there is correlation between the daily allowances of students…
A:
pls answer D on paper
Trending now
This is a popular solution!
Step by step
Solved in 4 steps with 1 images
- 10.24 The question of whether the sexual orientation of the mother has an impact on thesexual identity of her children was addressed in an article by Golombok and Tasker (1996).Twenty-five children of lesbian mothers and a control group of 21 children of heterosexual singlemothers were interviewed in their early twenties concerning their sexual orientation. The resultsof the interviews are given in the following table. Data were unavailable for 1 male child; thus,orientation is reported on only 20 children of heterosexual single mothers.Child’s OrientationMother’s Orientation Nonheterosexual HeterosexualLesbian 2 23Heterosexual 0 20a. What is the populations of interest in this study?b. Is the proportion of young adults identifying themselves as nonheterosexual higher for lesbian mothers than for heterosexual mothers? Use a 5 .05.c. Construct a 95% confidence interval on the difference in the two proportions of young adults who identify themselves as being heterosexual in their…15) Consumer Research, Inc., is an independent agency that conducts research on consumer attitudes and behaviors for a variety of firms. In one study, a client asked for an investigation of consumer characteristics that can be used to predict the amount charged by credit card users. Data were collected on annual income, household size, and annual credit card charges for a sample of 50 consumers. Prepare a managerial report that summarizes findings of an investigation of consumer characteristics that can be used to predict the amount charged by credit card users including annual income, household size, and annual credit card. Consider the complete data set. Income($1,000s) HouseholdSize AmountCharged($) 54 3 4,006 30 2 3,169 32 4 5,090 50 5 4,732 31 2 1,854 55 2 4,080 37 1 2,721 40 2 3,358 66 4 4,754 51 3 4,120 25 3 4,198 48 4 4,209 27 1 2,487 33 2 2,524 65 3 4,224 63 4 4,975 42 6 4,422 21 2 2,438 44 1 2,985 37 5 4,161 62 6 5,688 21 3 3,613…A student researcher was surprised to learn that the 2017 NCAA Student-Athlete Substance Use Survey supported that college athletes make healthier decisions in many areas than their peers in the general student body. He collected data of his own, focusing exclusively on male student-athletes to see if such habits vary based on one’s sport. He asked 93 male student-athletes whether they had engaged in binge-drinking in the last month (> 5 drinks in a single sitting). A student researcher was surprised to learn that the 2017 NCAA Student-Athlete Substance Use Survey supported that college athletes make healthier decisions in many areas than their peers in the general student body. He collected data of his own, focusing exclusively on male student-athletes to see if such habits vary based on one’s sport. He asked 93 male student-athletes whether they had engaged in binge-drinking in the last month (> 5 drinks in a single sitting). Data are provided in the table below.…
- 1)In a cross-tabulation or contingency table examining the relationship between breed of dog and whether the dog passed certification to become a service animal, it is found that, overrall, 62 percent of the dogs were certified. The data looked at this for 6 breeds of dogs. If breed and being certified are independent of each other, about what percentage of each breed would pass the test? 2)Which of the following features must be present in a research design if the researchers want their data to demonstrate a causal relationship? The cause must take place before the effect. To the extent possible, another variable that explains the relationship needs to be ruled out or accounted for. The two variables need to covary. These three features must all be present. O A and B A correlation coefficient r provides two pieces of information about a relationship between two variables. These are Strength; direction of relationship Direction, proportionsA sociologist wants to investigate the question, "Is there a relationship between texting during class and grade-point-average (GPA) among high school seniors in a large district?" Which study design is most appropriate? Before the semester starts, randomly select 40 seniors from each high school who do not text during class. Assign 20 to the texting treatment group (text three or more times during every class meeting) and 20 to the control group (no texting during class). At the end of the semester, obtain each student’s GPA from the appropriate admissions and records office. Compare the GPA of students who routinely text during class to the GPA of students who do not text during class. Before the semester starts, randomly select 40 seniors from each high school who do not text during class. Assign 20 to the texting treatment group (text three or more times during every class meeting) and 20 to the control group (no texting during class). At the end of the semester,…