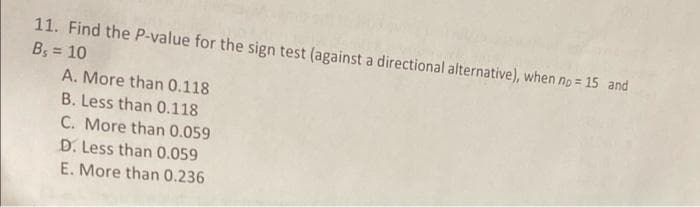
11. Find the P-value for the sign test (against a directional alternative), when np = 15 and B₁ = 10 A. More than 0.118 B. Less than 0.118 C. More than 0.059 D. Less than 0.059 E. More than 0.236


Q: the answer is cropped out.
A: The variable x denotes the number of accidents daily.
Q: Below is the number of new daily COVID-19 cases from February 1 to March 14, 2022, data from the…
A: Formula CI=point estimate ± ME
Q: According to timeanddate.com the mean temperature in NCR during the dry season is 29°C with a…
A: Given that,in dry season, Mean, x̄= 29 Standard deviation, Sigma= 3.5 H0: u= 32 H1: u=!32
Q: clinical researcher is conducting a study using an FDA approved medication that helps patients with…
A: Here's, number of trials are 350 and probability of success is 0.75
Q: An article published in the Canadian Journal of Zoology presented a method for estimating the body…
A: We have given 95% confidence interval for the average body fat percentage of porcupines is 17.4% to…
Q: An English teacher was interested in studying the words of Macbeth. She took a random Sample of 300…
A: The set or collection of all possible observations is defined as the population.
Q: has been observed that (2/3) of vehicles turn to the right direction and the remaining vehicles turn…
A: The question is about binomial dist. Given : Prop. of vehicle turn to the right direction ( p ) =…
Q: In a particular road intersection, it has been observed that (2/3) of vehicles turn to the right…
A: Given problem Given that In a particular road intersection, it has been observed that (2/3) of…
Q: can you give me a sample of this one? Test on mean for one sample
A: The test on mean for one sample The sample size should be less than 30 Then we use t test for one…
Q: Below is the number of new daily COVID-19 cases from February 1 to March 14, 2022, data from the…
A: Mean =ΣXi/n =…
Q: follow the steps outlined in lesson four to create a frequency and relative frequency distribution…
A: Given Information: No. of observations=55Sample space={41 54 47 40 39 35 50 37 49 42 70 32 44 52 39…
Q: A student claims that statistics students at her school spend, on average, an hour doing statistics…
A: Since you have asked multiple questions, we will solve the first question for you. If you want any…
Q: Find the value of X using Normal Distribution, if P(-X <Z<+X) = 0.9756 1.55 0.77 O 1.78 O 3.15 O…
A: For normal distribution, Population Mean,μ = 0 Population Standard Deviation,σ = 1
Q: In the advent of the Russia-Ukraine War, a driver surveyed 24 gasoline stations in Metro Manila, it…
A:
Q: The table below gives the number of accidents each year at a particular road junction: 2013 2014…
A: It is given that:
Q: (a) mean Round your answer to two decimal places (e.g. 98.76). (b) variance Round your answer to…
A: Given: The length of plate glass part is uniformly distributed.
Q: A random number generator generates a number between 0-1. Assume that each number is equally likely…
A: The distribution of random numbers follows a uniform distribution.
Q: 5. Show that for n attributes A, B, C, ...M. ... (ABC... M) ≥ (A) + (B) + (C) +. +(M)-(n-1) N, where…
A:
Q: A group of students is charged with dishonesty after taking the final examination. Which situation…
A: Given problem Given that A group of students is charged with dishonesty after taking the final…
Q: Question 10 Evaluate: 10! 3!(10-3)! 10! 3!(10-3)! =
A: The question is about to find value of factorial term
Q: 3. Let X₁, X2,..., Xn be iid random variables with mean and variance o2. Define the random variable…
A: Given that Suppose that X1 X2 x and be the iid random variable with mean μ and variance σ2 We…
Q: A The following are the scores of 8, 7, 8, 5, 6, 7, 9, 5, 7, 9, 6, 8, 4, 6, 9, 7, 8, 5, 7, 8, 10 1.…
A: The provided information is The observation are in ascending order…
Q: A p-value smaller than the significance level, a means.... the statistic is…
A: Given problem Given that A p-value smaller than the significance level, α means Ans) the…
Q: Your handwriting is not that clear is there any way you can type it out?
A: Given that, Records show that 30% of the avocados come from P, 55% come from Q and the rest come…
Q: 3. Determining confidence interval estimate (o is known). The standard deviation of the masses of…
A: Given Sample size n=50, sample mean x̄=24, population standard deviations σ=2.5 90% CI for…
Q: 17. The average household size in a certain region several years ago was 3.14 persons. A sociologist…
A:
Q: Find the value of X using Normal Distribution, if P(-X <Z <+X) = 0.9756 1.55 O 0.77 O 1.78 O 3.15 O…
A:
Q: In 2012, a teacher conducted a survey with 50 randomly selected college professors to know their…
A: Given,population standard deviation(σ)=60,000margin of…
Q: You are performing a left-tailed test with test statistic z = decimal places. p-value= 2.23, find…
A: Given problem Given that You are performing a left-tailed test with test statistic z = -2.23 We…
Q: In a particular road intersection, it has been observed that (2/3) of vehicles turn to the right…
A: Given,n=10p=13q=23Let X= in a sample of 10 vehicles no.of vehiclesturn to the left…
Q: Question 1: A social researcher wants to determine the impact of a forced move on adolescents…
A: Since we only do up to three subparts of a problem, we'll be doing the first three sub parts only.…
Q: 4. A set of 12 pairs of scores (X and Y values) produces a regression equation of Y-3X-4. Find the…
A: Since there are multiple questions, we will solve one question for you. To get remaining questions…
Q: From a group of 40 people( 30 women and 10 men) A jury of 12 people is selected. In how many…
A:
Q: If on an average, 6 ships out of 10 arrive safely, find the Mean and the S.D. of the number of ships…
A:
Q: Consider a drug that is used to help prevent blood clots in certain patients. In clinical trials,…
A: Given X=150 n=6197 Alpha=0.01
Q: 6. Draw the Histogram for the following data class 0-10 10-20 20-30 frequency 10 18 30 30-40 42…
A: The objective is to draw a histogram for the following data: class interval 0-10 10-20 20-30…
Q: μ = C. Weights of packed ground coffee in grams 350 346 350 346 340 347 344 340 355 348 351 355 347…
A: As per our guidelines we are suppose to answer only one question C)Given data is…
Q: Year Global plastic production (tonnes·year¯¹) 1975 46,000,000 1978 64,000,000 1981 72,000,000 1984…
A:
Q: A multiple choice test consists of 10 questions. Each question has 5 choices of which one is the…
A: The number of multiple choice questions is 10.
Q: The following data are times (in hours) between failures of air conditioning equipment in a…
A:
Q: In a recent study, a researcher wanted to find out if smoking have negative effects in health. A…
A: Given that Using excel regression
Q: The school registrar estimates that the dropout rate of senior high schools in Cavite is 75%. Last…
A: Given: Population proportion = 0.75 Number of selected freshman = 70 Sample size = 200
Q: A quality assurance officer ensures that their soft drink product adheres to the stated quantity of…
A: Given,sample size(n)=40mean(μ)=351.2 standard deviation(σ)=5.9
Q: Find the probability P (0<x<) for f(x) = x². cos x³ 0.235 O 0.304 O 0.908 O 0.413 O 0.678 O 0.112…
A:
Q: the claim that the mean GPA of night students is significantly different than 2.8 at the 0.1…
A: Given n=70 Alpha=0.10
Q: the product. Historical data suggests that the size of any given order is equally I 1. Identify the…
A: Discrete Random Variable: If a random variable takes at most a countable number of values, it is…
Q: Vp: P9 n
A:
Q: Characteristic Relative Frequency Cumulative Frequency Grade f r% cf c% A 16 B 8…
A: Here, Given, Grade f A 16 B 8 C 7 D 5 F 4 Formula: Relative…
Q: Mr. Chan puts $1000 in a bank account at the beginning of each month for 6 years. Find the total…
A:
Q: Font Existing procurement practices in Ghana Highway Authority 1 Threshold, complexity and urgent…
A: Mean, and standard deviation are important measures of central tendency and variation.

Step by step
Solved in 2 steps with 1 images

- Biologists have theorized that male Monarch butterflies have, onaverage, a larger thorax than do females. A sample of male and femalebutterflies yielded the data at right. Use df = 22 d. At α = .05 significance, use a t test (and find the P-value) to determine whether we should reject the hypothesis that H0 : μmale = μfemale and accept the directional alternative HA: μmale > μfemale. e. At α = .05 significance, use a t test (and find the P-value) to determine whether we should reject the hypothesis that H0 : μmale = μfemale and accept the directional alternative HA: μmale < μfemale.Assume df = 13 and alpha = 0.05. If Pearson's r = 0.510, then the null _____ and the relationship between the variables is _____ . a. should be rejected; significant b. should be rejected; not significant c. should not be rejected; significant d. should not be rejected; not significantI need on answer on why you would expect these pairs of observations to be dependent?
- Compute the absolute and relative errors in using c to approximate x. x = π; c = 3.14Conduct the hypothesis test for H0: µ = 10 versus Ha: µ =/10 (i.e µ is not equal to 10) where x bar = 9.6 and s = 3, n = 50. Use alpha = .01. Explain whether we should reject or accept the null hypothesis.for qs 27 option b, how do we get the value of SSE in this case ?
- Which of the following eta-squared results would indicate a very weak relationship between the dependent and independent variables? .15 .35 65 .95express the null hypotehsis and the alternative hypothesis in symbolic form. the manufacturer of a refrigerator system for beer kegs produces refrigerators that are supposed to mantain a true mean temperature, u, of 43 F, ideal ofr a certain type of German pilsner. the owner of the brewery does not agree with the refrigerator manufacturer, and claims he can prove that the true mean temperature is incorrectFor the attached scenario, substitute the t values and complete the table for the attached question 4?
- Which of the following describes a spurious relationship between X, Y, and Z? Select one: a. Z causes X, which causes Y b. Z has no effect on the relationship between X and Y c. Z causes both X and Y d. X causes Z, which causes YAlpha is usually set at .05 but it does not have to be; this is the decision of the statistician. Alpha is usually set at .05 but it does not have to be; this is the decision of the statistician. True FalseI do a Bonferroni correction and I want to make a four tests, I assume a .05 level of signifance to start. What is my new alpha level? A. .05 B. .10 C. .125 D. Impossible to calculate without more information