Year Global plastic production (tonnes·year¯¹) 1975 46,000,000 1978 64,000,000 1981 72,000,000 1984 86,000,000 1987 104,000,000 1990 120,000,000 1993 137,000,000 1996 168,000,000 1999 202,000,000 2002 231,000,000 2005 263,000,000 2008 281,000,000 2011 325,000,000 2014 367,000,000


Q: Contrary to popular opinion, a psychologist claims that the mean IQ score of math instructors ... is…
A:
Q: Vp Pq n N-n 7-1
A:
Q: The population of weights of a particular fruit is normally distributed, with a mean of 501 grams…
A: GivenMean(μ)=501standard deviation(σ)=5sample size(n)=11
Q: The school registrar estimates that the dropout rate of senior high schools in Cavite is 75%. Last…
A: According to our policy we can answer only first three part for remaining please repost the…
Q: The following data set shows the weekly advertising expenditure and sales of 12 retail merchants…
A: To create scatter plot we represent independent variable cost(x) on x axis and dependent variable…
Q: 7.40 A manufacturer of four-speed clutches for automo- biles claims that the clutch will not fail…
A: Given: µ0=50000
Q: The Human ager of a company employing 200 workers conducts a survey to investigate whether there is…
A: Correlation is a parametric associational statistic that is extensively used by the statistician to…
Q: Create properly formatted tables that compare the prevalence of obesity with respect to sex and…
A: Given Information: No. of variables=02Variables=1. Level of obesity with respect to sex2. Level of…
Q: and (A) (B) = x, = 2x, = 3x, Show that if 8. N N (AB) _ (BC) _ (AC) 1 = y, then the value of neither…
A:
Q: 13. The following statements tell about the t-distribution EXCEPT A. The standard deviation of the…
A: T distribution is similary to the normal distribution. It is used when the sample size is low and…
Q: In order to ensure efficient usage of a server, it is necessary to estimate the mean number of…
A: Givensample size(n)=100Mean(x)=37.7standard deviation(s)=9.2
Q: III. Directions: Solve the following problems. Show your complete solution. Round off your answer…
A: The provided information is µ=190 and σ=30 The standard deviation for the sampling distribution…
Q: The monthly electric bill for a local business had a mean of 1135. The values go from 1160 to 1300…
A: Given Information: mean=1135Minimum value=1160Maximum value=1300
Q: Suppose that the duration of a particular type of criminal trial is known to be normally distributed…
A:
Q: 1. It was proven that the mean weight of a bag of cement is 250 grams with a standard deviation of…
A: It is interpreted that: μ0 claimed average weight=260σ =21.5n sample size=40
Q: For public information, an outsourced statistics professional was asked to provide an average daily…
A: The provided information is x¯=32σ=6.5n=50α=0.02 The critical value is zc=2.326 (from z table)…
Q: 5. An experiment was conducted to test whether a newly developed p additive can increase the mileage…
A: Solution: Let x =Mileage with additive and y= Mileage without additive x y d=x-y (d-d)2…
Q: the answer is cropped out.
A: The variable x denotes the number of accidents daily.
Q: Ahmed owans a gas station. The cars arrive at the gas station according to uniform distribution with…
A:
Q: can you give me a sample of this one? Test on mean for one sample
A: The test on mean for one sample The sample size should be less than 30 Then we use t test for one…
Q: Suppose the National Transportation Safety Board (NTSB) wants to examine the safety of compact cars,…
A: We need to test whether the mean pressure applied to the driver's head during a crash test is equal…
Q: Tp = Ppq n N-n 1-7
A: We have to prove the following formula:
Q: Sixteen randomly selected business establishments were found to have a mean water consumption of 800…
A: Given that Sample size n =16 Sample mean =800 Standard deviation =175
Q: p = Р9 N-n N-1
A:
Q: The following data were collected in the study described in Problem 1 relating hypertensive status…
A: Given data free of stroke at 5 years…
Q: III. Directions: Solve the following problems. Show your complete solution. Round off your answer…
A: Given n=sample size=15, sample mean x̄=400, s=17.50 Construct 95% CI for population mean μ
Q: Add a lottery, hundred tickets were sold and three prizes are to be given. How many possible…
A: Given n=100 r=3
Q: 3. Problem 6. Yna likes to play cards. She draws 14 cards from a pack of 52 cards. What is the…
A: 3. The random experiments is follows hypergeometric distribution N=52 cards k=36 cards n=14 x=4…
Q: Suppose that the weight of seedless watermelons is normally distributed with mean 6.9 kg. and…
A: The mean is 6.9 and the standard deviation is 1.2.
Q: An number cube (a fair die) is rolled 3 times. For each roll, we are interested in whether the roll…
A:
Q: When conducting a significance test for correlation, if your null and alternative hypothesis are:…
A: Test is that whether or not the correlation is significant.
Q: A manufacturer of window frames knows from past experience that 10 per cent of the production will…
A: "Since you have posted a question with multiple subparts , we will solve the first three subparts…
Q: 17. The average household size in a certain region several years ago was 3.14 persons. A sociologist…
A: Given that Sample size n =75 Sample mean =2.98 Standard deviation =0.82
Q: About 0.5% of adults have nut allergy. The test correctly identifies 94% of the time adults with…
A:
Q: (a) Which data set indicates a perfect positive linear relationship between its two variables?…
A: Correlation :- Correlation is a defined as a relationship between X and Y, Where X is…
Q: Consider a drug that is used to help prevent blood clots in certain patients. In clinical trials,…
A: Given X=150 n=6197 Alpha=0.01
Q: a. If there is a negative correlation between anxiety and performance on complex tasks, then either…
A: Comments: As per the our company guidelines we are supposed to answer only three subparts. Kindly…
Q: III. Directions: Solve the following problems. Show your complete solution. Round off your answer…
A:
Q: hello am still a bit confudes , so what would be the answer ?
A:
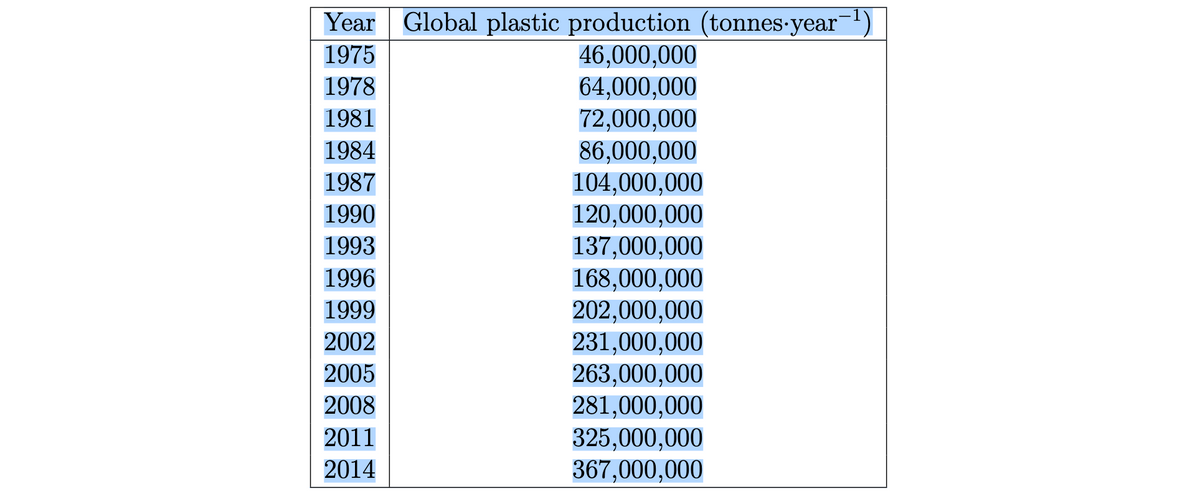
Q: Use an exponential model for this data and do it by hand and state why it is better to use…
A: Given Information: Year Global plastic production 1975 46000000 1978 64000000 1981 72000000…
Q: Motorists arrive at a Gulf gas station at the rate of two per minute during morning hours. a) What…
A:
Q: Professor Miguel wants to ensure he is thorough in his review of student performance, so he decides…
A:
Q: Directions: Supply the sought measures. (If the calculated value is in decimal, write up to/round to…
A: We have given Data are 2, 1, 3, 0, 1, 3, 6, 0, 3, 3, 5, 2, 1, 4, 2 From the above data we will find…
Q: 18. An automobile manufacturer recommends oil change intervals of 3,000 miles. To compare actual…
A:
Q: At the .05 significance level, does the data below show significant correlation? y 5 22.1 6 20.35 7…
A: X:5,6,7,8,9,10,11 Y:22.1,20.35,17.2,16.85,8.2,17.45,17
Q: In an advanced ballet dance class, it is claimed that 42% of dancers can successfully perform a…
A: Given: Sample size, n=27 No. of dancers can successfully perform a double pirouette turn, x=13
Q: III. Directions: Solve the following problems. Show your complete solution. Round off your answer…
A: Given Standard deviations σ =2.5, sample size n=50, sample mean x̄=24 90% CI for population mean μ
Q: Let X be a discrete random variable such that: P(X=0)=1-T and P(X= 40) = π 5 and 0 otherwise, where…
A: X is a discrete random variable such that PX=x=π x=401-π x=0 Let us consider a…
Q: According to timeanddate.com the mean temperature in NCR during the dry season is 29°C with a…
A: Given : sample size, n =7 sample mean, x̄ =32 population standard deviation,σ=3.5…
Q: Let X denote the reaction time, in seconds, to a certain stimulus and Y denote the temperature (F)…
A:
designe and expontential

Step by step
Solved in 3 steps with 3 images

- Country Birth rate GNP Growth Income ratio Bangladesh 47 140 0.3 2.3 Tanzania 47 280 1.9 3.2 Sierra Leone 46 320 0.4 3.3 Sudan 47 380 -1.3 3.9 Kenya 55 380 2.9 6.8 Indonesia 35 530 4.1 3.4 Panama 30 1910 3.1 8.6 Chile 25 2560 0.7 3.8 Venezuela 35 4220 2.4 4.9 Turkey 33 1540 3.5 4.9 Malaysia 31 1840 4.3 5 Nepal 44 150 0 4.7 Malawi 56 200 2.7 2.4 Argentina 20 2560 1.9 3.6 Test for the joint significance of the coefficients on growth and the income ratio. What other possible explanatory variables do you think it might be worth investigating?Year Population 1790 3,929,214 1800 5,308,483 1810 7,239,881 1820 9,638,453 1830 12,866,020 1840 17,069,453 1850 23,191,876 1860 31,443,321 1870 39,818,449 1880 50,155,783 1890 62,947,714 1900 75,994,575 1910 91,972,266 1920 105,710,620 1930 122,775,046 1940 131,669,275 1950 150,697,361 1960 179,323,175 1970 203,302,031 1980 226,545,805 1990 248,709,873 2000 281,421,906 2010 308,745,538 What is the equation of the Least Squares Regression Line for the census data? (need to include correct values for a and b) Using the line, you calculated in number 5, what would you predict the population to have been in 1985? EXPLAIN. Should you use the previously calculated Regression Line to predict population in the year 2200? EXPLAIN.Year Population 1790 3,929,214 1800 5,308,483 1810 7,239,881 1820 9,638,453 1830 12,866,020 1840 17,069,453 1850 23,191,876 1860 31,443,321 1870 39,818,449 1880 50,155,783 1890 62,947,714 1900 75,994,575 1910 91,972,266 1920 105,710,620 1930 122,775,046 1940 131,669,275 1950 150,697,361 1960 179,323,175 1970 203,302,031 1980 226,545,805 1990 248,709,873 2000 281,421,906 2010 308,745,538 Use excel to calculate the Least Squares Regression Line for the census data? (need to include correct values for a and b) Using the line, you calculated in number 5, what would you predict the population to have been in 1985? EXPLAIN. Should you use the previously calculated Regression Line to predict population in the year 2200? EXPLAIN.
- Year Population 1790 3,929,214 1800 5,308,483 1810 7,239,881 1820 9,638,453 1830 12,866,020 1840 17,069,453 1850 23,191,876 1860 31,443,321 1870 39,818,449 1880 50,155,783 1890 62,947,714 1900 75,994,575 1910 91,972,266 1920 105,710,620 1930 122,775,046 1940 131,669,275 1950 150,697,361 1960 179,323,175 1970 203,302,031 1980 226,545,805 1990 248,709,873 2000 281,421,906 2010 308,745,538 Submit a scatterplot of the above data Calculate the correlation (r) for the above data set. What does (r) tell us about the association of this data? EXPLAIN. What does (r) tell us about the strength of the correlation of the above data? EXPLAIN. What is the equation of the Least Squares Regression Line for the census data? (need to include correct values for a and b) Using the line, you calculated in number 5, what would you predict the population to…Price Age Mileage13590 6 6148513775 6 5434422991 1 824615303 4 2485616388 3 2210016600 3 2370216987 4 4740118489 2 1688818859 3 3538019857 3 2963411877 9 5579214989 3 4618315900 3 3700916500 4 455219440 9 8690212988 5 7724115777 6 5964710490 9 932418938 10 4822111988 8 42408 The accompanying table shows a portion of data consisting of the price, the age, and the mileage for 20 used sedans. Price Age Mileage 13590 6 61485 13775 6 54344 ⋮ ⋮ ⋮ 11988 8 42408 Determine the sample regression equation that enables us to predict the price of a sedan on the basis of its age and mileage. (Negative values should be indicated by a minus sign. Round your answers to 2 decimal places.) [If you are using R to obtain the output, then first enter the following command at the prompt: options(scipen=10). This will ensure that the output is not in scientific…Sheet Thickness 1 0.0403 2 0.0693 3 0.0632 4 0.0651 5 0.0534 6 0.0574 7 0.0400 8 0.0515 9 0.0542 10 0.0555 11 0.0512 12 0.0525 13 0.0434 14 0.0392 15 0.0607 16 0.0575 17 0.0637 18 0.0358 19 0.0455 20 0.0319 21 0.0578 22 0.0488 23 0.0402 24 0.0318 25 0.0447 26 0.0306 27 0.0325 28 0.0542 29 0.0416 30 0.0517 31 0.0448 32 0.0520 33 0.0495 34 0.0525 35 0.0618 36 0.0571 37 0.0391 38 0.0655 39 0.0568 40 0.0370 41 0.0505 42 0.0425 43 0.0611 44 0.0491 45 0.0574 46 0.0603 47 0.0420 48 0.0616 49 0.0463 50 0.0340 51 0.0609 52 0.0457 53 0.0409 54 0.0367 55 0.0713 56 0.0576 57 0.0515 58 0.0549 59 0.0325 60 0.0470 61 0.0203 62 0.0379 63 0.0442 64 0.0384 65 0.0409 66 0.0358 67 0.0442 68 0.0538 69 0.0486 70 0.0317 71 0.0529 72 0.0449 73 0.0437 74 0.0384 75 0.0400 76 0.0397 77 0.0486 78 0.0296 79 0.0548 80 0.0407 81 0.0552 82 0.0412 83…
- year Income ($) B P1994 6036 85.1 20.41995 6113 87.8 20.21996 6271 88.9 21.31997 6378 94.5 19.91998 6727 99.9 181999 7027 99.5 19.92000 7280 104.2 22.22001 7513 106.5 22.32002 7728 109.7 23.42003 7891 110.8 26.22004 8134 113.7 27.12005 8322 113 292006 8562 116 33.52007 9042 108.7 42.82008 8867 115.4 35.62009 8944 118.9 32.22010 9175 127.4 33.72011 9381 123.5 34.42012 9735 117.9 48.52013 9829 105.4 66.12014 9722 103.2 62.42015 9769 104.2 58.62016 9725 103.7 56.72017 9930 105.7 55.52018 10419 105.5 57.32019 10625 106.5 53.72020 10905 107.3 52.6 Make a forecast of Mr. X's Income for the next five years Make forecast of income for the given values of B =110 and P = 55Earnings and Height Earnings Height Sex 84004.75 59 0 84075.75 59 0 7822.854004 59 0 84110.75 59 0 84098.75 60 0 44138.16016 60 0 17116.26367 60 0 84070.75 60 0 84058.75 60 0 84089.75 60 0 38917.33594 60 0 33729.96875 60 0 44165.16016 61 0 33715.96875 61 0 49407.10938 61 0 84118.75 61 0 33613.96875 61 0 28509.38672 61 0 44145.16016 61 0 84033.75 61 0 44218.16016 61 0 33661.96875 61 0 84025.75 61 0 84117.75 61 0 28601.38672 61 0 33784.96875 61 0 49462.10938 61 0 33632.96875 62 0 18198.8418 62 0 44153.16016 62 0 83967.75 62 0 83994.75 62 0 44121.16016 62 0 83961.75 62 0 10807.42871 62 0 83980.75 62 0 23410.87305 62 0 38952.33594 62 0 84014.75 62 0 83979.75 62 0 84043.75 62 0 23369.87305 62 0 44170.16016 62 0 84056.75 62 0 44205.16016 62 0 84100.75 62 0 84116.75 62 0 23388.87305 62 0 23400.87305 63 0 49370.10938 63 0 9938.505859 67 1 84063.75 67 1 23422.87305 67 1 38867.33594…ore analysis reserve
- Age Male Females 21 0.001420 0.000472 22 0.001488 0.000487 23 0.001502 0.000496 24 0.001474 0.000503 25 0.001430 0.000509 26 0.001393 0.000519 27 0.001366 0.000535 28 0.001362 0.000561 29 0.001379 0.000595 30 0.001406 0.000637 A- a 23 year old female pays $275 for 1-year $150,000 life insurance policy. what is the expected value of the policy fo the policyholder? B- a 23 year old female pays $275 for 1-year $150000.00 life insurane policy what is the expected value of the policy for the insurance company?Price SqFt 600000 2767 545000 2731 314900 2051 419000 2084 365000 2270 479000 1950 323000 1235 339900 2116 399000 1644 552000 2415 223017 1375 315777 1529 499000 2223 575000 2327 342000 1879 375000 1558 349000 2012 485000 1200 549888 1410 295000 1943 399000 1827 306999 1840 265200 1636 479000 2357 249700 1152 539500 2650 365000 2154 295900 1279 499000 2156 526000 2493 514900 2390 346000 1347 460000 2120 389000 1917 499000 1200 405000 2643 389900 1789 545000 2327 339000 1742 425000 1746 479000 1421 392000 2569 Interpret b0 in the context of this problem. Interpret b1 in the context of this problem. What percent of total variation in prices is explained by the regression model? Provide evidence to support your answer. Please include the excel function.Expenses MSA Expenses Regular Health MSA Health Regular 413.92 597.83 2 2 150.55 353.84 1 1 287.26 540.03 1 1 609.82 551.42 2 2 358.9 620.41 2 1 317.87 507.36 1 1 415.75 507.05 2 1 256.73 673.14 2 1 429.24 525.77 1 1 0 333.1 2 2 429.23 383.78 1 1 598.42 616.68 1 1 424.7 460.88 1 1 293.94 223.27 1 1 25.5 559.87 1 1 481.93 579.1 1 1 347.73 447.95 1 1 235.12 476.57 1 1 353.91 408.15 1 2 197.22 397.14 1 1 125.61 415.49 1 1 376.86 517.23 1 2 337.36 404.87 1 1 481.22 639.35 1 1 367.8 454.03 1 2 164.3 289.86 2 1 330.54 546.59 1 1 338.36 361.42 1 1 187.62 518.18 2 2 292.97 561.44 1 1 384.85 482.4 1 1 286.55 361.51 1 1 566.91 658.18 2 2 225.1 590.34 2 1 148.96 584.15 1 1 373.36 665.71 1 1 168.28 468.04 1 1 281.64 247.68 1 1 555.2 331.35 1 1 354.1 391.79 1 1 409.97 433.39 1 1 605.43 403.15 1 1 440.25 416.28 2 1 513.88 645.89 1 1 348.7 820.4 1 2 431.81 682.14 1 1 205.47 254.64 1 1 304.87 627.84 1 1…


