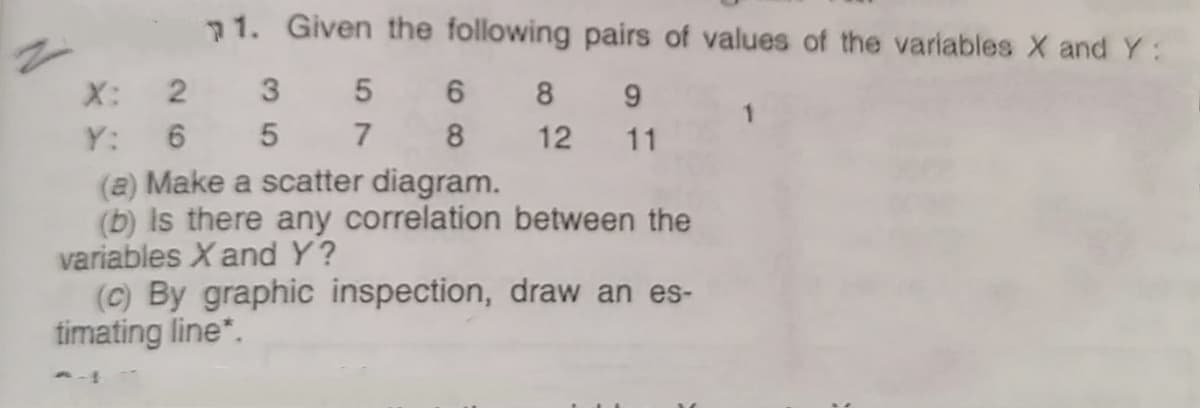
11. Given the following pairs of values of the variables X and Y: X: 2 3 5 6 8 9 6 5 7 8 (a) Make a scatter diagram. (b) is there any correlation between the variables X and Y? (C) By graphic inspection, draw an es- timating line". Y: 12 11


Q: If X and Y are independent the correlation cofficient between X and Y is equal zero
A: If x and y are independent, means they are uncorrelated , correlation coefficient is zero. Given…
Q: Here is a bivariate data set. x y 10 246 2 122 54 36 31 -27 -23 7 18 -9 -3 241
A: The table with the calculations is shown below:
Q: 1.79 Explain what each of the following sample correlation co- ww efficients tells you about the…
A: Here we have to define what following correlation coefficients tells about the relationship between…
Q: 13. The following table shows the distribution of nappies consumed per day by number of babies in a…
A: Hi! Thank you for the question, as per the honor code, we are allowed to answer three sub-parts at a…
Q: 3. The following sample contains values of the price and quantity sold of a particular commodity.…
A:
Q: D. A group of research students wants to determine whether there is a correlation between the number…
A: Given : Month X (No. of theft cases) Y(No. Vandalism cases) Jun 6 3 Jul 15 6 Aug 30 15…
Q: A national consumer magazine reported the following correlations. The correlation between car…
A: Given Data: Correlation between car weight and car reliability = -0.6 Correlation between car weight…
Q: 3. ( Consider the following table showing speed limits and death rates from automobile acciaents in…
A: Solution: Let x= Speed limit ( Miles per hour) and y = Death rate x y (x-x) (x-x)2 (y-y)…
Q: Find the correlation coefficient r for the given set of data. x y 2 9 4 11 5 19 7 23 How do you…
A: We have given that the data in tabulation form of two variables X and Y. Correlation coefficient…
Q: 15. A researcher measures the relationship between narcissism and willingness to help. If SP =…
A: We have given that, SP = 240, SSX = 320, and SSY = 410 Then, We will find the correlation…
Q: Answer the following questions about the relationships between pairs of variables and the values of…
A: Correlation is the degree or extent of relationship between two variables.
Q: Given the supply of a commodity, x, and the price of a commodity, y, would you expect a positive…
A: The supply of a commodity is directly related to its price. If a price of a good increase, the…
Q: 3. he following sample contains values of the price and quantity sold of a particular commodity. Use…
A: Assume that price is defined as x and quantity is defined as y.
Q: Given the following corresponding set of data values for x and y: x 37 42 50 56 y 52 70 73 100 The…
A: Given the following corresponding set of data values for x and y: x 37 42 50 56 y 52 70 73 100
Q: 1. The following table indicates the data from 8 students between the physic and chemistry courses.…
A: Assuming the following order: Excellent > Very Good > Good > Poor > Very Poor. value…
Q: ΣX2 = 65 ΣY2 = 54100 X̅ = 2.3 Y̅ = 73…
A:
Q: The following is the Density and Death Rate in 6 cities in the Sultanate of Oman. Density 2 5 4 7 6…
A:
Q: 1- The table shows data on the number of visitors to the UK in a month, v (1000s), and the amount of…
A: 1. Step-by-step procedure to find the sample correlation coefficient using Excel: In Excel sheet,…
Q: A national consumer magazine reported the following correlations. The correlation between car…
A: Correlation determines the linear degree of association between variables. It lies between -1 and 1.…
Q: 1. The following table indicates the data from 8 students between the physic and chemistry courses.…
A: Since you’ve posted more than one question, we will solve the first complete question and request…
Q: California highways were monitored and the following relationship between speed and breaking…
A: a) Enter the data in the cells A1:B6. The correlation coefficient using the Excel formula “=CORREL…
Q: 1. For each of the following, indicate whether you would expect a positive or a negative…
A: Note: Hey there! Thank you for the question. As you have posted multiple questions, we have solved…
Q: Imagine that there are only two points in a scatterplot. 7. How do you position these points so that…
A: Since you have asked multiple questions, we will solve the first question for you. If you want any…
Q: 2) During a 6 weeks period, a Quick Sell dealer kept a weekly record of the number x of TV ads…
A: a)
Q: Suppose the correlation between variables x and y is r = - 1. Also suppose that the data contains…
A: As the stated correlation coefficient is, r=-1, which is assumed as a perfect negative correlation.…
Q: onsider the following small data set. Subject x y 1 13 28 2 17 31 3 8 15 4 6 21 5 4 30 Find the…
A: Given: The data regarding x and y values are as follows x y 13 28 17 31 8 15 6 21 4…
Q: 3. (b) The coefficient of rank correlation between the marks obtained by 10 students in Mathematics…
A: Let N be a no. of the student (N)=10 R1 is initial rank coefficient =0.5
Q: Based on the given data, is the purchase of hot dogs independent of the purchase of hamburgers? If…
A: Given data: Hot Dogs Hot Dogs¯ Sum Hamburger 2000 500 2500 Hamburger¯ 1000 1500 2500…
Q: (4) An emergency service wishes to see whether a relationship exists between the outside temperature…
A: a) Steps of create scatter Plot; 1. Enter the data in excel then, 2. Go to insert --- scatter plot…
Q: For a data set of brain volumes (cm3) and IQ scores of ten males, the linear correlation…
A: Here the p-value indicates the probability of linear correlation coefficient is 38.4%
Q: Consider the given sets of explanatory variables and response variables. The exact values of X1 and…
A: The last statement the correlation coefficients for these two tables would not be the same is not…
Q: 2. Graph the following points, and draw in the line of best fit. Comment on the fit of this line,…
A: Given data: x y 1 -1 2 2 3 4 4 8 5 9 6 13 7 17 28 52
Q: 1 80 76 76 87 95 69 67 94 84 ∑x = *, ∑x2 = **, ∑y = ***, ∑y2 = ****, ∑xy = ***** Question: (d)…
A: Given a data set By using this data se i calculate correlation coefficient (r) and coefficient of…
Q: 13. Let x be the independent variable representing the number of car accidents for eight similarly…
A:
Q: 4. Given the following sample data: x 420 y 2.80 3.60 610 625 500 400 450 550 650 480 565 3.75 3.00…
A: a. Table including calculations:
Q: The following data show the results of a study based on the number of hours college students spend…
A: Hello! As you have posted more than 3 sub parts, we are answering the first 3 sub-parts. In case…
Q: Suppose we compute a correlation coefficient between two variable of r= 0. Which of the following…
A: Given Information: Correlation coefficient between two variables is 0 i.e., r = 0 Correlation…
Q: 35. FILE Given the following sample of five observations, develop a scalter diagram, using x as the…
A: Given: The provided data is: x -8 -16 12 2 18 y 58 247 153 3 341 where, x is the…
Q: Suppose that for a set of (x,y) data, r² = 0.2916. Find the linear correlation coefficient. Do not…
A: Provided information: For a set of (x,y) data,r2 = 0.2916
Q: Suppose the correlation between variables x and y isr = – 1. Also suppose that the data contains the…
A: Solution
Q: given by the following table: y X-4 -2 2 4 -2 0 0.25 0 0 -1 0 0.25 1 0.25 0|0 2 0.25 Find the…
A: Given: X -4 -2 2 4 total -2 0 0.25 0 0 0.25 Y -1 0 0 0 0.25 0.25 1…
Q: if you have the following data for x and y x 22682 y 2165 1 then the correlation coefficient between…
A:
Q: is any type of relationship between the amount of an alumnus’s contribution (in dollars) and the…
A:
Q: (a) For what range of values can the coefficient of correlation of a sample of 52 pairs be…
A: The correlation coefficient is the relation between variables and is between -1 and 1. -1 and 1…
Q: Which of the following values cannot be a correlation coefficient? Group of answer choices -.274…
A: We know that the correlation coefficient is always between -1 and 1. Among the given options, only…
Q: Find the correlation coefficient between the variables X and Y presented in the table: X 1 3 4 6 8…
A: From the provided information, x 1 3 4 6 8 9 11 18 y 1 2 4 4 5 7…
Q: If the coefficient of correlation between x and y is close to -1.0, which of the following…
A: Coefficient of correlation is close to -1.0
Q: If the correlation coefficient obtained from data pairs of variables X and Y is 0.98 the strength…
A: correlation coefficient The correlation coefficient r measures the direction and strength of a…


Trending now
This is a popular solution!

Step by step
Solved in 3 steps with 3 images

- 1. Based on a sample of size 6, if the mean weight of 60-year old individuals at the time of survey was 200 lbs and the mean number of years they lived after the survey was 7.3 years and if the corresponding standard deviations were 35.8 lbs and 3.3 years and the correlation based on these six pairs is -0.82, what would be slope and intercept for the line of best fit? A. Slope = 22.4, intercept = -0.08 B. Slope = -0.08, Intercept = 22.4 C. Slope = 22.4, intercept = 0.08 D. Slope = 0.08, Intercept = 22.4 2. What would be the line of best fit in question 1? A. y = 22.4 - 0.08x B. y = 22.4 + 0.08x C. y = -22.4 + 0.08x D. y = -22.4 - 0.08x 3. Based on your line of best fit in question 2, if a person weighs 190 lbs, how many more years you would expect him to be alive? A. 2 years B. 4 years C. 8 years D. 12 yearsThe correlation between two variables is a measure of the degree to which O Data points cluster together around an imaginary straight line. -Data points cluster together around an imaginary straight line. -A person's value on a variable Y can be predicted by the person's value on variable X. -Both A and B -Neither A nor BSuppose that for variables x and y, we find that the correlation coefficent r= .750. Assuming that α=.05α=.05, what is the minimum number of data points n, that is requried so that a signficant linear correlation is present? a. n=6 b. n=7 c. n=8 d. It cannot be determined from the given data
- The ages (in years) of 10 men and their systolic blood pressures (in millimeters of mercury) are shown in the attached data table with a sample correlation coefficient r of 0.920 Remove the data entry for the man who is 50 years old and has a systolic blood pressure of 198 millimeters of mercury from the data set and find the new correlation coefficient. Describe how this affects the correlation coefficient r. Use technology. Age,_x Systolic_blood_pressure,_y16 10825 12238 14445 13450 19863 18372 19932 13158 17722 119 The new correlation coefficient r ____going from 0.920 to ____ (Round to three decimal places as needed.) .After a first-order model was fitted to the data, the coefficient of correlation between the usage in hours per week (x) of a particular brand of computer and the maintenance cost of the computer (y) is calculated as 0.84. Interpret the value of the coefficient of determination.Given that the linear correlation coefficient r is found to be 0.867, what is the proportion of the variation in the left arm measurements that is explained by the relationship between the right and left arm measurements? Right arm 102 101 94 79 79 Left arm 175 169 182 146 144
- The ages (in years) of 10 men and their systolic blood pressures (in millimeters of mercury) are shown in the attached data table with a sample correlation coefficient r of 0.911. Remove the data entry for the man who is 50 years old and has a systolic blood pressure of 199 millimeters of mercury from the data set and find the new correlation coefficient. Describe how this affects the correlation coefficient r. Use technology. Age,_x Systolic_blood_pressure,_y17 10924 12338 14545 13350 19964 18371 19828 13058 17322 117 The new correlation coefficient r _____ going from 0.911 to ______.Compute the value of correlation coefficient of using data in table 1 for the number of hrs. a person works per week and thenumber of accidents or injuries that the person has over a peroid of one week. Table :1 Hrs.Worked ( x ) No. of accidents( y ) 30 2 42 3 25 4 44 8 56 5The ages (in years) of 10 men and their systolic blood pressures (in millimeters of mercury) are shown in the attached data table with a sample correlation coefficient r of 0.910. Remove the data entry for the man who is 49 years old and has a systolic blood pressure of 199 millimeters of mercury from the data set and find the new correlation coefficient. Describe how this affects the correlation coefficient r. Use technology. Age, x Systolic blood pressure, y 16 110 26 122 39 142 44 132 49 199 64 185 72 199 31 130 56 174 23 117 Click the icon to view the data set. The new correlation coefficient r ▼ A. gets stronger, b.gets weaker, C.stays the same, going from 0.910 to= . (Round to three decimal places as needed.)
- Imagine that there is a correlation of r = 0.65 between variable X and variable Y. Based on the correlation between these two variables (and only these two variables), what is a person's predicted value on variable Y, when his X value on variable X is a z score of 1.5? Please provide your answer as a z score with a minimum of three decimal places.In order to indicate a strong negative correlation between variables, the correlation coefficient will be near 0 Greater than or equal to 0.7 near -10 Less than or equal to -0.7 or greater than or equal to 0.7 Less than or equal to -0.7 near 10 near 1/2A pediatrician wants to determine the relation that may exist between a child's height and head circumference. She randomly selects eleven 3-year-old children from her practice and measures their heights and head circumference. According to the data, the linear correlation coefficient between the height and head circumference of a child is 0.918. Compute the coefficient of determination, R squared.