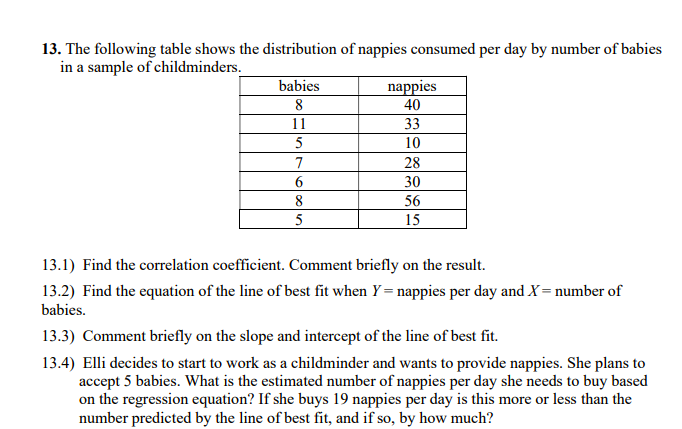
13. The following table shows the distribution of nappies consumed per day by number of babies in a sample of childminders._ babies nappies 8 40 11 33 5 10 7 28 6 30 8 56 5 15 13.1) Find the correlation coefficient. Comment briefly on the result. 13.2) Find the equation of the line of best fit when Y= nappies per day and X = number of babies. 13.3) Comment briefly on the slope and intercept of the line of best fit.
13. The following table shows the distribution of nappies consumed per day by number of babies in a sample of childminders._ babies nappies 8 40 11 33 5 10 7 28 6 30 8 56 5 15 13.1) Find the correlation coefficient. Comment briefly on the result. 13.2) Find the equation of the line of best fit when Y= nappies per day and X = number of babies. 13.3) Comment briefly on the slope and intercept of the line of best fit.

Glencoe Algebra 1, Student Edition, 9780079039897, 0079039898, 2018
18th Edition
ISBN:9780079039897
Author:Carter
Publisher:Carter
Chapter10: Statistics
Section10.6: Summarizing Categorical Data
Problem 23PPS

Related questions
Question
Practice Pack
Transcribed Image Text:13. The following table shows the distribution of nappies consumed per day by number of babies
in a sample of childminders.
babies
nappies
8
40
11
33
5
10
7
28
6
30
8
56
5
15
13.1) Find the correlation coefficient. Comment briefly on the result.
13.2) Find the equation of the line of best fit when Y= nappies per day and X = number of
babies.
13.3) Comment briefly on the slope and intercept of the line of best fit.
13.4) Elli decides to start to work as a childminder and wants to provide nappies. She plans to
accept 5 babies. What is the estimated number of nappies per day she needs to buy based
on the regression equation? If she buys 19 nappies per day is this more or less than the
number predicted by the line of best fit, and if so, by how much?
Expert Solution
This question has been solved!
Explore an expertly crafted, step-by-step solution for a thorough understanding of key concepts.

Includes step-by-step video

Learn your way
Includes step-by-step video

Step by step
Solved in 2 steps with 1 images

Recommended textbooks for you
Glencoe Algebra 1, Student Edition, 9780079039897…
Algebra
ISBN:
9780079039897
Author:
Carter
Publisher:
McGraw Hill

Big Ideas Math A Bridge To Success Algebra 1: Stu…
Algebra
ISBN:
9781680331141
Author:
HOUGHTON MIFFLIN HARCOURT
Publisher:
Houghton Mifflin Harcourt
Glencoe Algebra 1, Student Edition, 9780079039897…
Algebra
ISBN:
9780079039897
Author:
Carter
Publisher:
McGraw Hill
Big Ideas Math A Bridge To Success Algebra 1: Stu…
Algebra
ISBN:
9781680331141
Author:
HOUGHTON MIFFLIN HARCOURT
Publisher:
Houghton Mifflin Harcourt