12 10 40 120 160 200 Frequency of Number of Prisoners 2.

Algebra & Trigonometry with Analytic Geometry
13th Edition
ISBN:9781133382119
Author:Swokowski
Publisher:Swokowski
Chapter10: Sequences, Series, And Probability
Section10.7: Distinguishable Permutations And Combinations
Problem 6E

Related questions

Concept explainers
Contingency Table
A contingency table can be defined as the visual representation of the relationship between two or more categorical variables that can be evaluated and registered. It is a categorical version of the scatterplot, which is used to investigate the linear relationship between two variables. A contingency table is indeed a type of frequency distribution table that displays two variables at the same time.
Binomial Distribution
Binomial is an algebraic expression of the sum or the difference of two terms. Before knowing about binomial distribution, we must know about the binomial theorem.
Topic Video
Question
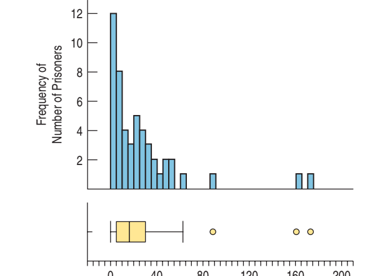
Opposites In a way, boxplots are the opposite of histo-
grams. A histogram divides the number line into equal
grams. A histogram divides the number line into equal
intervals and displays the number of data values in each
interval. A boxplot divides the data into equal parts and
displays the portion of the number line each part covers.
interval. A boxplot divides the data into equal parts and
displays the portion of the number line each part covers.
These two plots display the number of incarcerated pris-
oners in each state as of June 2006.a) Explain how you could tell, by looking at a boxplot,
where the tallest bars on the histogram would be located.
b) Explain how both the boxplot and the histogram can
indicate a skewed distribution.
c) Identify one feature of the distribution that the
histogram shows but a boxplot does not.
d) Identify one feature of the distribution that the boxplot
shows but the histogram does not.
Transcribed Image Text:12
10
40
120
160
200
Frequency of
Number of Prisoners
2.
Expert Solution
This question has been solved!
Explore an expertly crafted, step-by-step solution for a thorough understanding of key concepts.

This is a popular solution!

Trending now
This is a popular solution!

Step by step
Solved in 2 steps

Knowledge Booster


Learn more about
Need a deep-dive on the concept behind this application? Look no further. Learn more about this topic, statistics and related others by exploring similar questions and additional content below.Recommended textbooks for you
Algebra & Trigonometry with Analytic Geometry
Algebra
ISBN:
9781133382119
Author:
Swokowski
Publisher:
Cengage

Algebra: Structure And Method, Book 1
Algebra
ISBN:
9780395977224
Author:
Richard G. Brown, Mary P. Dolciani, Robert H. Sorgenfrey, William L. Cole
Publisher:
McDougal Littell
Algebra & Trigonometry with Analytic Geometry
Algebra
ISBN:
9781133382119
Author:
Swokowski
Publisher:
Cengage
Algebra: Structure And Method, Book 1
Algebra
ISBN:
9780395977224
Author:
Richard G. Brown, Mary P. Dolciani, Robert H. Sorgenfrey, William L. Cole
Publisher:
McDougal Littell