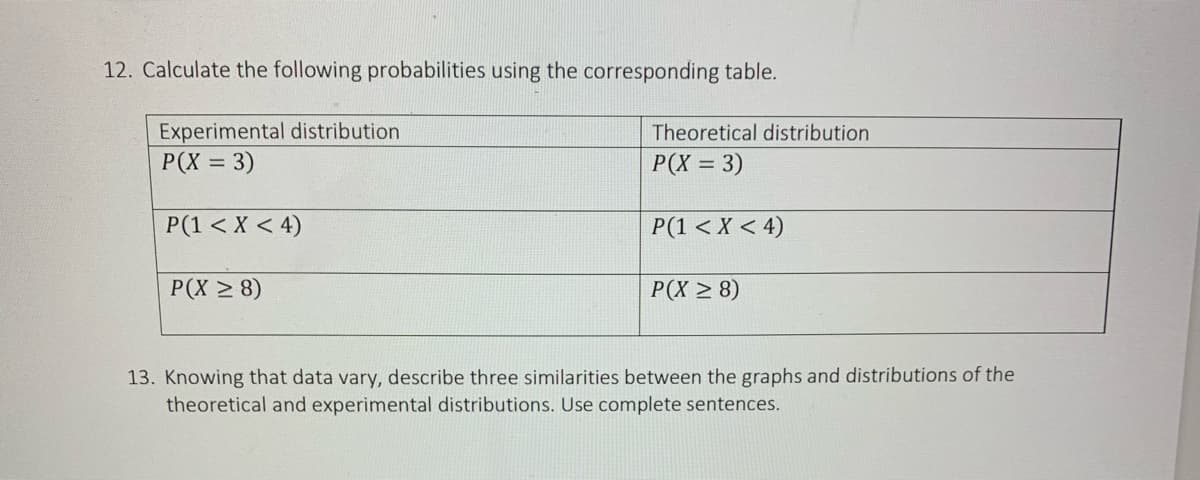
12. Calculate the following probabilities using the corresponding table. Experimental distribution P(X = 3) P(1 < X <4) P(X ≥ 8) Theoretical distribution P(X = 3) P(1 < X < 4) P(X ≥8)


Q: The average student loan debt for college graduates is $25,350. Suppose that that distribution is…
A: Given,mean(μ)=$25,350standard deviation(σ)=$10,100
Q: ou conduct a cross-sectional study of 800 patients to test a new screening tool for diabetes. In…
A: Given information: The number of patients who had false negative and false positive screens is 42,…
Q: In a regression analysis involving 30 observations, the following estimated regression equation was…
A: Let y denotes the dependent (or study) variable that is linearly related to k independent (or…
Q: It is believed that using a solid state drive (SSD) in a computer results in faster boot times when…
A: Since you have posted multiple questions, we will provide the solution only to the first question as…
Q: Find the indicated z score. The graph depicts the standard normal distribution with mean 0 and…
A: given data, standard normal curve:X~N(0,1)μ=0σ=1
Q: a) What proportion of the area under the normal curve is greater than z = 1.65? b). Find the -score…
A: Solution
Q: a. What is the distribution of X? X ~ N( b. What is the median seedless watermelon weight? c. What…
A: Here AS PER POLICY I HAVE CALCULATED FIRST 3 SUBPARTS. POST REMAINING PARTS WITH NOTE I NEED THIS…
Q: A major oil company has developed a new gasoline additive that is supposed to increase mileage. To…
A: Let d=(gas mileage with additive)−(gas mileage without additive)
Q: B. Answer what is asked from each number using proper probability notation and units wherever…
A: Let's define the null and alternative hypotheses as follows: Null Hypothesis (H0): The average…
Q: For normal population, the sample mean M = 35 has the same absolute value of the Z – score as a…
A: Suppose the variable of interest is x.
Q: IQ scores form a normal distribution with a mean of μ =105 and a standard deviation of σ = 11.…
A: Let M be the random variable from normal distribution with mean (μ) = 105, standard deviation (σ) =…
Q: 4. A newspaper story claims that more houses are purchased by singles now than singles 5 years ago.…
A:
Q: In September a biological research team caught, weighed, and released a random sample of 24…
A: According to the given information in this question We need to find the 90% confidence interval
Q: Medical researchers often use linear regression to understand the relationship between new drug…
A: The given problem contains two drugs A and B which effect the blood pressure. We are required to…
Q: The City of Calgary reports that the number of vehicles that use the Crowchild Trail bridge varies…
A: Given information: μ=107500, σ=8800
Q: You wish to test the following claim (H) at a significance level of a = 0.01. H₂:41 = 2 Ha: 12 You…
A: Given : n1 = 13 dof1 = n-1 = 13-1 = 12 Mean1 = 62.9 S1= 8.7 n2 = 18 dof2 = n-1 = 18-1 = 17 Mean2…
Q: A statistical program is recommended. You may need to use the appropriate technology to answer this…
A: Given data: Average monthly gas bill Age Square footage Rooms 70.2 16 2537 6 81.33 2 3457 8…
Q: Researchers at a pharmaceutical company have found that the effective time duration of a safe dosage…
A: Here the given information is Researchers at a pharmaceutical company have found that the effective…
Q: I don't believe this answer is correct. Wouldn't it be "not enough information given to determine"?…
A: The solution is as given in step.2
Q: Create CI’s and PI’s (that are W-H adjusted) for all 8 X1*X2 combinations in the experiment. Explain…
A: Given, The upper confidence limit and lower confidence limit are also the upper and lower value of…
Q: Q1. Consider a p-chart with 3 sigma control limits. The in-control process fraction nonconforming is…
A: Given information: Consider a p-chart with 3 sigma control limits. The in-control process fraction…
Q: can you do problem 4 as well
A: Given that, X has a following continuous distribution:- f(x) = x23 , -1≤x≤2
Q: Suppose that they said that the item you bought online will be delivered between 2 and 8 o'clock…
A: Note: Hi there! Thank you for posting the questions. As there are multiple sub parts, according to…
Q: Assume that a procedure yields a binomial distribution with a trial repeated n = 11 times. Use…
A: Given Using Binomial distribution n=11 times k=8 and p=0.33 P(X=K)=?
Q: A statistical program is recommended. Suppose the following data shows a company's annual revenue…
A: Solution: From the given information,
Q: Find the indicated IQ score. The graph to the right depicts IQ scores of adults, and those scores…
A: According to the given information in this question We need to find the value of x
Q: 11% of all Americans live in poverty. If 31 Americans are randomly selected, find the following…
A: given data, p=p( Americans live in poverty)=0.11n=31q=1-p=1-0.11=0.89x= no. of Americans live in…
Q: entify the incorrect statement below: ven the binomial distribution, X~ B(10, 0.4) There are 10…
A: Let X be the random variable from binomial distribution with probability of success (p) = 0.4 and…
Q: Meredith Grey has asked every surgeon at Grey-Sloan Memorial Hospital the following question: "How…
A: Given data(X) of the surgeries;…
Q: 2. A researcher claims that at least 10% of all football helmets have manufacturing flaws that could…
A: Given that A researcher claims that at least 10% of all football helmets have manufacturing flaws…
Q: Download the dataset, SummaryStats.xls. Use Excel to calculate the SAMPLE VARIANCE of H. (Round to…
A: Given data The formula for the sample variance is as follows, Var=∑i=1n(Xi-X¯)2n-1 Xi are the data…
Q: Suppose you work for a statistics company and have been tasked to develop an efficient way of…
A: We are given a normal random variable X~N0,1 whose PDF if given by: fx,y=12πe-x22…
Q: Please show your complete solution. Thank you! Please use Excel if possible. Problem: A sample…
A: From the provided information, it is obtained that: The sample size, n=800. The no. of defective…
Q: n a population-based cohort study, an entire community was interviewed regarding smoking habits and…
A: Given that: Number of Individuals Lung Cancer Deaths Smokers 24500 15 Non-smokers 10500 2
Q: Suppose that the average waiting time for a patient at a physician's office is just over 29 minutes.…
A:
Q: A particular professor never dismisses class early. Let x denote the amount of time past the class…
A: From given GRAPH READS GRAPH will be :
Q: Find the area of the shaded region under the standard normal distribution between the given…
A: Required probability is P(0.47<Z<2.36)
Q: Assume that when adults with smartphones are randomly selected, 52% use them in meetings or classes.…
A: Given information-No. of people uses them in meaatings(p) = 0.52sample…
Q: A statistics professor plans classes so carefully that the lengths of her classes are uniformly…
A: From given length of class are uniformly disttibuted with a=45 , b-55 so, f(x)=1b-a=155-45=110…
Q: How many different arrangements of the word PARRAMATA are possible?
A: (4) Given word PARRAMATA
Q: The American Heart Association is about to conduct an anti-smoking campaign and wants to know the…
A: Suppose p is the population proportion of all Americans over 35 who smoke.
Q: above table of averages and standard deviations represents the average length of a precision part…
A: Given that Average Standard Deviation Brand A 20.01mm .7mm Brand B 19.99mm 1.2mm Brand C 19.98mm…
Q: A company produces light bulbs with a mean lifetime of 800 hours and a standard deviation of 100…
A:
Q: The weights (in pounds) of eight vehicles and the variabilities of their braking distances (in feet)…
A: The total number of pairs of observations is n = 8.
Q: Use the following study (link here) to answer the following questions below: What are the…
A: This study examines the effects of high-dose zinc and ascorbic acid supplementation compared to…
Q: Suppose a company has two factories that produce a particular product. The first factory produces…
A: event A : product of first factoryevent B : product of second factoryevent D : product is…
Q: A coin is flipped 4 times. What is the probability of getting at least 3 heads? What is the…
A: GIVEN DATA, A coin is flipped 4 timesn=4p(head)=12=0.5p(tail)=12 =0.5probability of getting 2 heads…
Q: Consider the following multivariate dataset X 2 203111TO CT CO CO CT INN CO 2 1 5 3 3 (A) Test the…
A: This question deals with performing hypothesis tests on a multivariate dataset. The given dataset…
Q: Assume that the readings at freezing on a batch of thermometers are normally distributed with a mean…
A: GivenMean(μ)=0oCstandard deviation(σ)=1.000C
Q: Question no 1Suppose the heights of a group of people follow a normal distribution with a mean of…
A: Given,mean(μ)=170standard deviation(σ)=10Sample size(n)=50

Step by step
Solved in 2 steps with 3 images

- By first calculating, and then combining, the number of counts in each individual 30- second period, what does student A determine as the average decay rate (in counts/sec), and what is its uncertainty?John Kittle, an independent insurance agent, uses a five-year moving average to forecast the number of claims made in a single year for one of the large insurance companies he sells for. He has just discovered that a clerk in his employ incorrectly entered the number of claims made four years ago as 1,400 when it should have been 1,200.a. What adjustment should Mr. Kittle make in next year’s forecast to take into account the corrected value of the number of claims four years ago?b. Suppose that Mr. Kittle used simple exponential smoothing with a = .2instead of moving averages to determine his forecast. What adjustment is now required in next year’s forecast? (Note that you do not need to know the value of the forecast for next year in order to solve this problem.)1. Interpret the data which has been presented in thr below Table 1 and Table 2.
- 1. Per the CDC article, men have higher blood pressure than women. Is this also true for this wholesale distribution center population? Use 0.05. Determine whether your (NEW) sample provides statistical evidence that this company’s population of adults has men with a higher blood pressure than women. Set alpha at 0.05 just focus on the Systolic number.Kaitlyn measures the upload speed in megabits per second of her home broadband internet connection during peak hours and off-peak hours. The results are provided in the accompanying table. Peak Off-Peak 5.83 5.14 6.05 6.80 7.14 6.98 3.54 5.77 5.45 7.27 5.90 6.62 5.81 6.19 4.82 6.08 6.37 6.59 4.65 5.58 5.30 7.41 6.48 6.26 5.96 6.37 5.79 6.31 6.84 6.55 5.06 4.95 5.61 7.03 6.45 6.77 Examine the results of Kaitlyn's test to determine the statements that compare the medians and interquartile ranges of the data sets to each other in terms of this situation. Select the two correct answers. The median upload speed during peak hours is 5.905 megabits per second, which is less than the median upload speed during off-peak hours, 7.005 megabits per second. The upload speeds during peak hours are slower on average compared to off-peak times. The median upload speed during peak hours is 6.37 megabits per second, which is greater than the median upload speed during…Table 217 of the 2006 U.S. Statistical Abstract shows that, among all 25–34 year olds, the average annual earnings of a high school graduate with no further education was $26,073 while the average annual earnings of a college graduate with no further education was $43,794 in 2003. a. Assuming college requires five years, show that the annual return to each year of college education averages 10.9 percent. b. It is typically thought that this type of calculation of the returns to schooling is biased because it doesn’t take into account innate ability (i.e., ability in the workplace not due to college) or innate motivation. If this criticism is true, is the actual return to each year of a college education more than or less than 10.9 percent?
- To seethe effect of a relatively small error in the estimate of the amountof carbon-14 in a sample being dated, consider this hypotheticalsituation: A bone fragment found in central Illinois in the year 2000 contains 17% of its original carbon-14 content. Estimate the year the animal died.Five different paints are marketed as having same drying time. To verify the manufacturer’s claim, the dry times were measured in seconds and recorded. Test the claim that the drying times are equal at a=0.05. Paint 1 697 708 697 689 695 702 698 699 700 701 Paint 2 694 694 713 690 709 711 697 704 707 713 Paint 3 695 702 703 703 701 699 695 688 702 686 Paint 4 677 708 702 705 689 696 691 692 704 700 Paint 5 699 695 694 704 701 694 698 703 704 699Find the normal curve and show solutions