nd Inter-Correlations among Study Variables. D Reliability 1 2 3 8 0.88 (0.852) 0 0.97 0.786 (0.919) 4 0.95 0.635 0.577 (0.876) 01 level (2-tailed) sis on Women Leadership Behaviour. R² F Df Sig.
nd Inter-Correlations among Study Variables. D Reliability 1 2 3 8 0.88 (0.852) 0 0.97 0.786 (0.919) 4 0.95 0.635 0.577 (0.876) 01 level (2-tailed) sis on Women Leadership Behaviour. R² F Df Sig.

Glencoe Algebra 1, Student Edition, 9780079039897, 0079039898, 2018
18th Edition
ISBN:9780079039897
Author:Carter
Publisher:Carter
Chapter10: Statistics
Section10.4: Distributions Of Data
Problem 19PFA

Related questions
Question
1. Interpret the data which has been presented in thr below Table 1 and Table 2.
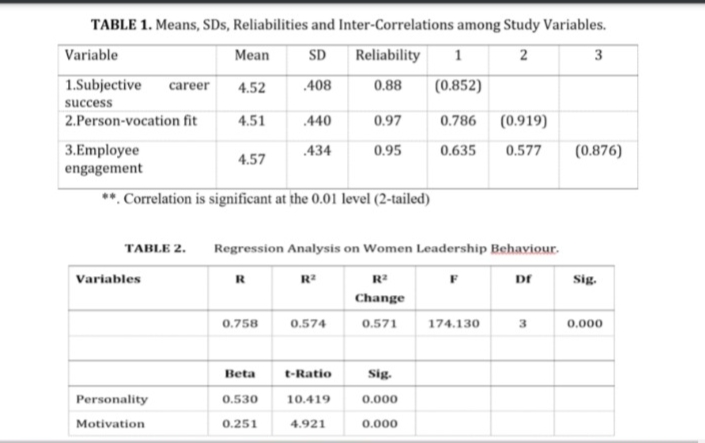
Transcribed Image Text:TABLE 1. Means, SDs, Reliabilities and Inter-Correlations among Study Variables.
Variable
Mean
SD Reliability 1
2
3
4.52
.408
0.88
(0.852)
1.Subjective career
success
2.Person-vocation fit
4.51
.440
0.97
0.786 (0.919)
3.Employee
.434
0.95
0.635 0.577 (0.876)
4.57
engagement
**. Correlation is significant at the 0.01 level (2-tailed)
TABLE 2.
Variables
Personality
Motivation
Regression Analysis on Women Leadership Behaviour.
R
Dr
Change
0.758
0.574
0.571
174.130
3
Beta
t-Ratio
Sig.
0.530
10.419
0.000
0.251
4.921
0.000
Sig.
0.000
Expert Solution
This question has been solved!
Explore an expertly crafted, step-by-step solution for a thorough understanding of key concepts.

Step by step
Solved in 2 steps with 2 images

Recommended textbooks for you
Glencoe Algebra 1, Student Edition, 9780079039897…
Algebra
ISBN:
9780079039897
Author:
Carter
Publisher:
McGraw Hill
Glencoe Algebra 1, Student Edition, 9780079039897…
Algebra
ISBN:
9780079039897
Author:
Carter
Publisher:
McGraw Hill