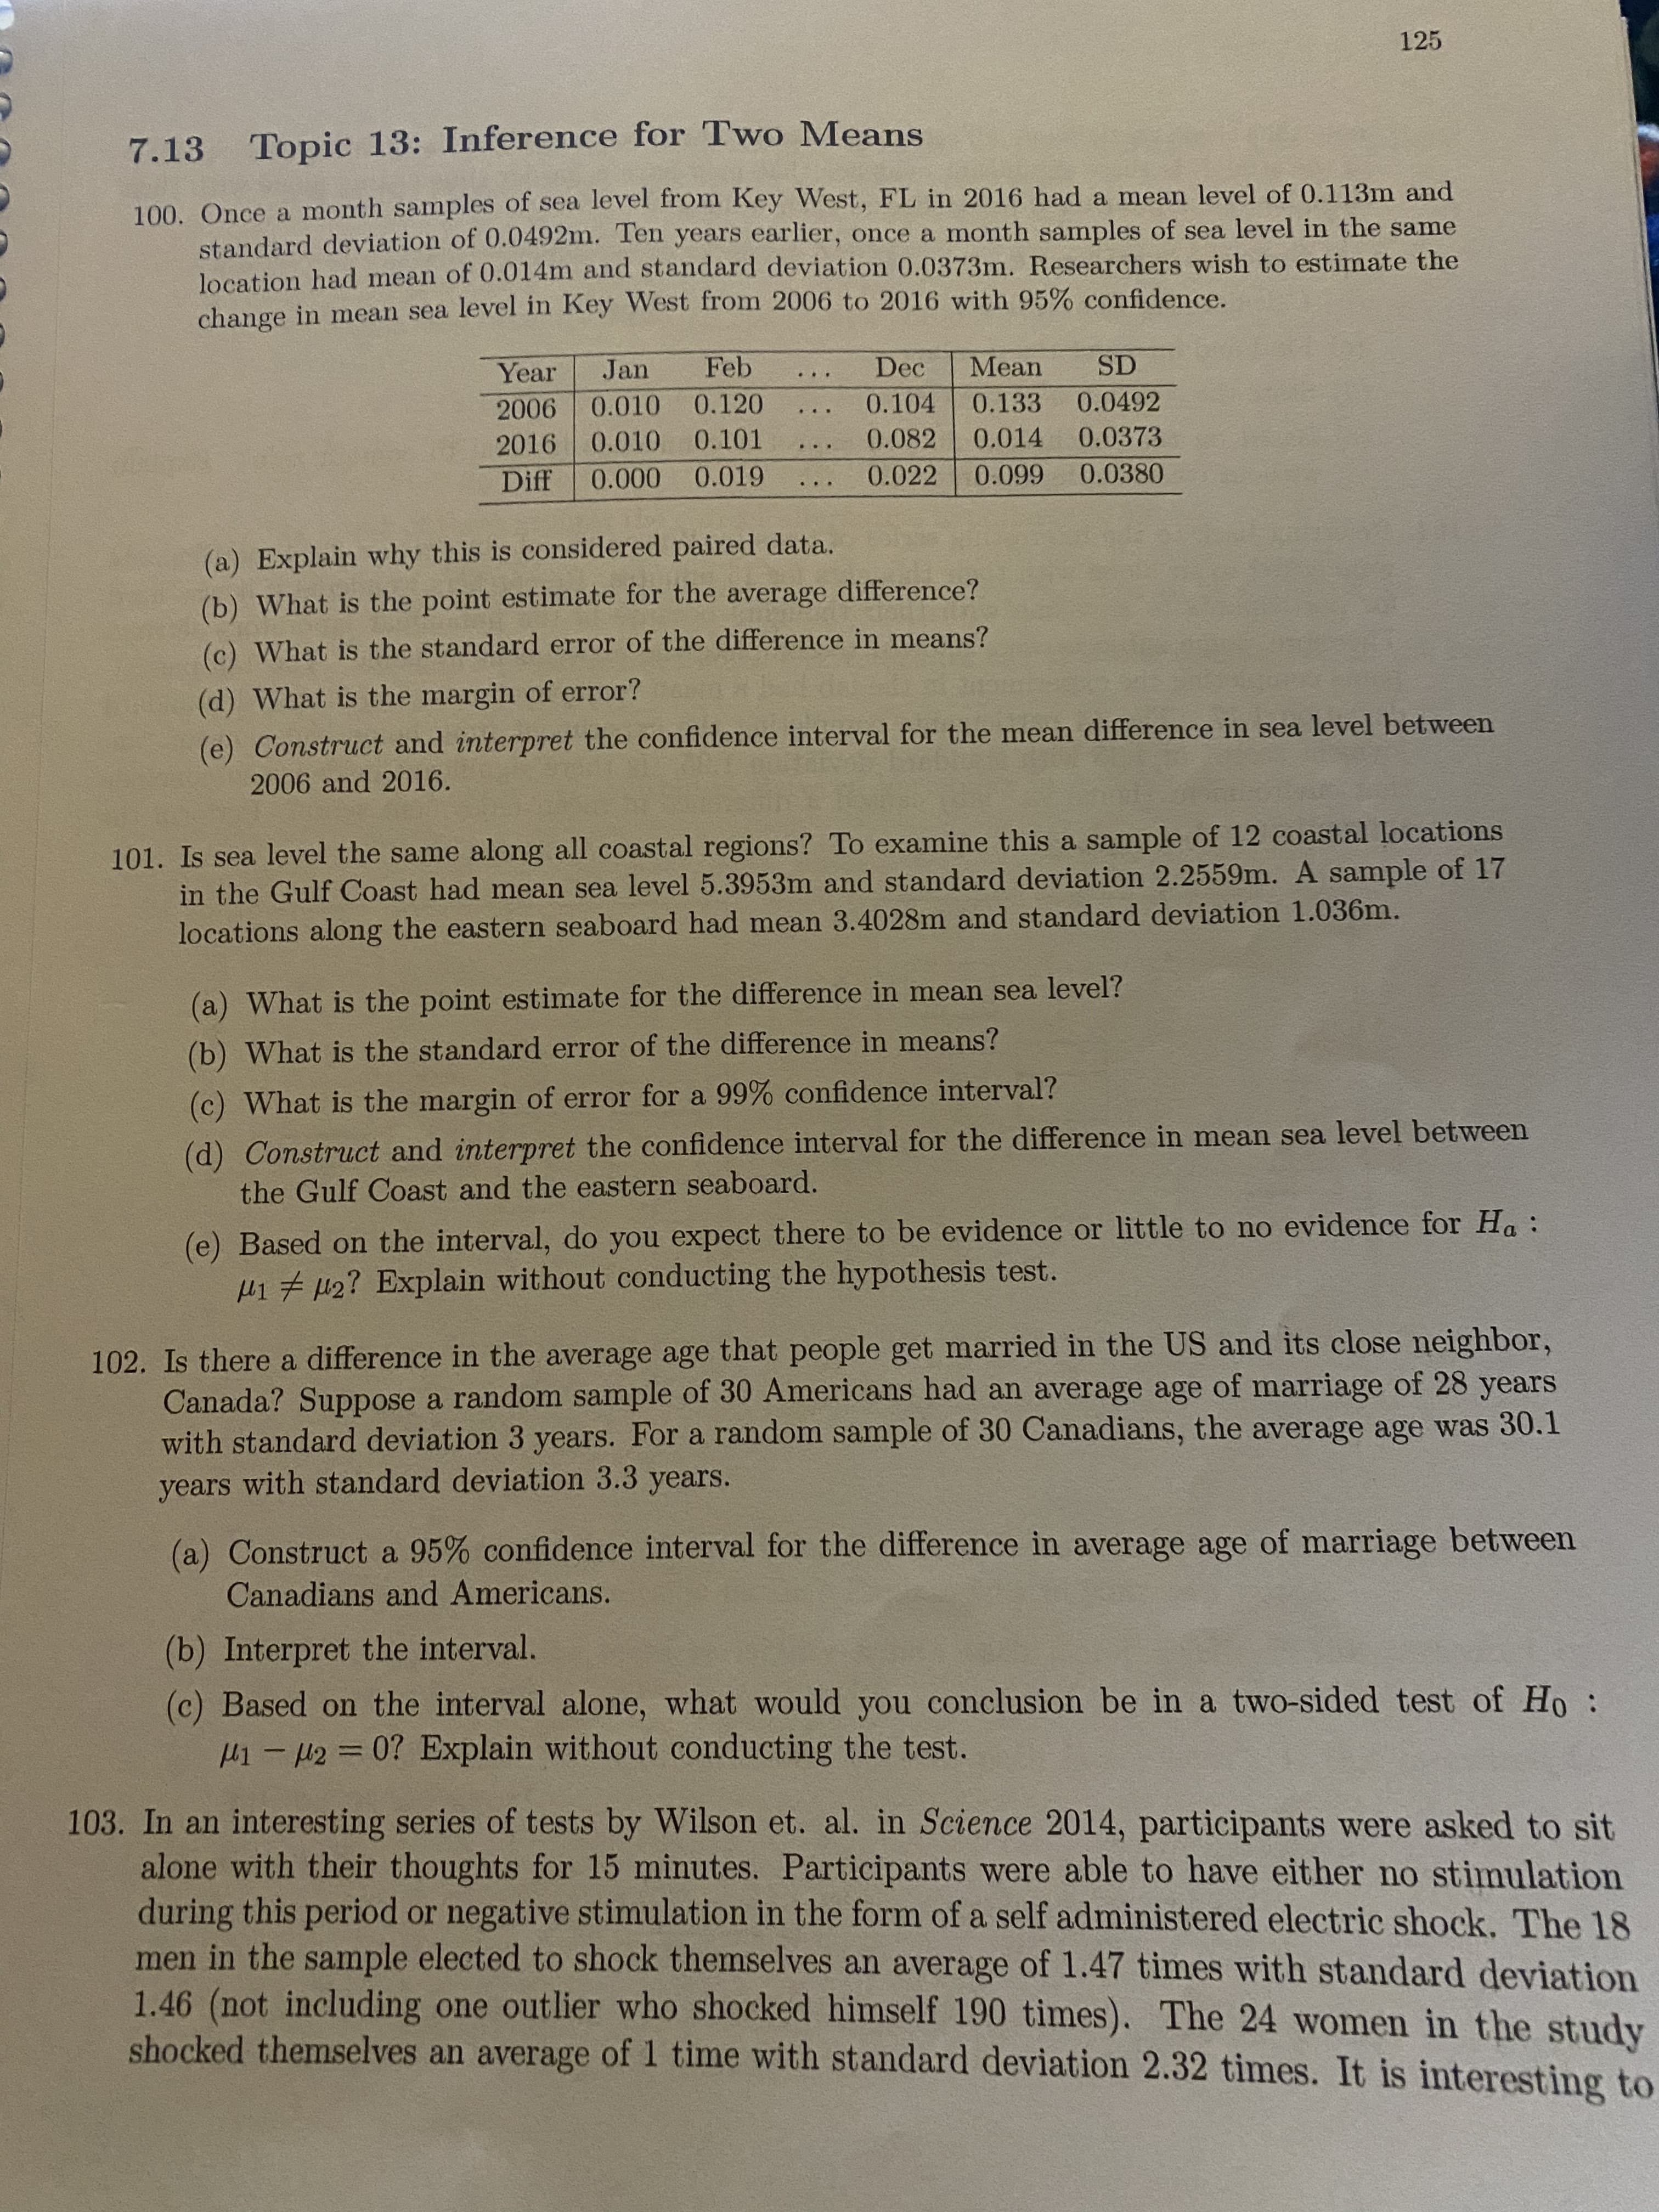
125 7.13 Topic 13: Inference for Two Means 100. Once a month samples of sea level from Key West, FL in 2016 had a mean level of 0.113m and standard deviation of 0.0492m. Ten years earlier, once a month samples of sea level in the same location had mean of 0.014m and standard deviation 0.0373m. Researchers wish to estimate the change in mean sea level in Key West from 2006 to 2016 with 95% confidence. Year Jan Feb Dec Mean SD 2006 0.010 0.120 0.104 0.133 0.0492 2016 0.010 0.101 0.082 0.014 0.0373 ... Diff 0.000 0.019 0.022 0.099 0.0380 (a) Explain why this is considered paired data. (b) What is the point estimate for the average difference? (c) What is the standard error of the difference in means? (d) What is the margin of error? (e) Construct and interpret the confidence interval for the mean difference in sea level between 2006 and 2016. 101. Is sea level the same along all coastal regions? To examine this a sample of 12 coastal locations in the Gulf Coast had mean sea level 5.3953m and standard deviation 2.2559m. A sample of 17 locations along the eastern seaboard had mean 3.4028m and standard deviation 1.036m. (a) What is the point estimate for the difference in mean sea level? (b) What is the standard error of the difference in means? (c) What is the margin of error for a 99% confidence interval? (d) Construct and interpret the confidence interval for the difference in mean sea level between the Gulf Coast and the eastern seaboard. (e) Based on the interval, do you expect there to be evidence or little to no evidence for Ha : H17 42? Explain without conducting the hypothesis test. 102. Is there a difference in the average age that people get married in the US and its close neighbor, Canada? Suppose a random sample of 30 Americans had an average age of marriage of 28 years with standard deviation 3 years. For a random sample of 30 Canadians, the average age was 30.1 years with standard deviation 3.3 years. (a) Construct a 95% confidence interval for the difference in average age of marriage between Canadians and Americans. (b) Interpret the interval. (c) Based on the interval alone, what would you conclusion be in a two-sided test of Ho: H1-2= 0? Explain without conducting the test. %3D 103. In an interesting series of tests by Wilson et. al. in Science 2014, participants were asked to sit alone with their thoughts for 15 minutes. Participants were able to have either no stimulation during this period or negative stimulation in the form of a self administered electric shock. The 18 men in the sample elected to shock themselves an average of 1.47 times with standard deviation 1.46 (not including one outlier who shocked himself 190 times). The 24 women in the study shocked themselves an average of 1 time with standard deviation 2.32 times. It is interesting to 126 note that these participants all said they would pay not to receive the shock in an earlier portion of the study! Is there sigmificant evidence that men have a harder time sitting alone with their thoughts (i.e administered more shocks) than women? (a) State the hypotheses for the test. (b) Calculate the test statistic. (c) Find and interpret the p-value. (d) State the conclusion of the test. (e) Based on the conclusion, do you expect a confidence interval to contain zero? Explain without constructing the interval. 104. Referring back to the interesting series of tests by Wilson et. al. in Science 2014, participants were asked to sit alone with their thoughts for 15 minutes. Researchers wondered if it was hard for participants to sit alone with their thoughts because of the unfamiliar laboratory setting. Therefore, some subjects were allowed to complete the experiment at home. The 146 partici- pants completing the experiment in the lab had a mean "enjoyment score" of 5.12 with standard deviation 1.77. The 44 participants completing the experiment from home had a mean "en- joyment score" of 4.35 with standard deviation 1.95. Is there significant evidence to conclude that environment (home vs. lab) caused a difference in mean enjoyment score? Perform the appropriate test.


Percentage
A percentage is a number indicated as a fraction of 100. It is a dimensionless number often expressed using the symbol %.
Algebraic Expressions
In mathematics, an algebraic expression consists of constant(s), variable(s), and mathematical operators. It is made up of terms.
Numbers
Numbers are some measures used for counting. They can be compared one with another to know its position in the number line and determine which one is greater or lesser than the other.
Subtraction
Before we begin to understand the subtraction of algebraic expressions, we need to list out a few things that form the basis of algebra.
Addition
Before we begin to understand the addition of algebraic expressions, we need to list out a few things that form the basis of algebra.
Number 103 part D and E


Trending now
This is a popular solution!

Step by step
Solved in 3 steps


