128499 Use a linear regression to answer the following: E According to the linear regression model, the population changes by approximately how many people each year? (round to one decimal place) The coefficient of determination is: R- (round to two decimal places) The linear model is a good fit for the observed data. True O False
128499 Use a linear regression to answer the following: E According to the linear regression model, the population changes by approximately how many people each year? (round to one decimal place) The coefficient of determination is: R- (round to two decimal places) The linear model is a good fit for the observed data. True O False

Functions and Change: A Modeling Approach to College Algebra (MindTap Course List)
6th Edition
ISBN:9781337111348
Author:Bruce Crauder, Benny Evans, Alan Noell
Publisher:Bruce Crauder, Benny Evans, Alan Noell
Chapter5: A Survey Of Other Common Functions
Section5.3: Modeling Data With Power Functions
Problem 1E: Zipfs Law The following table shows U.S cities by rank in terms of population and population in...

Related questions
Question
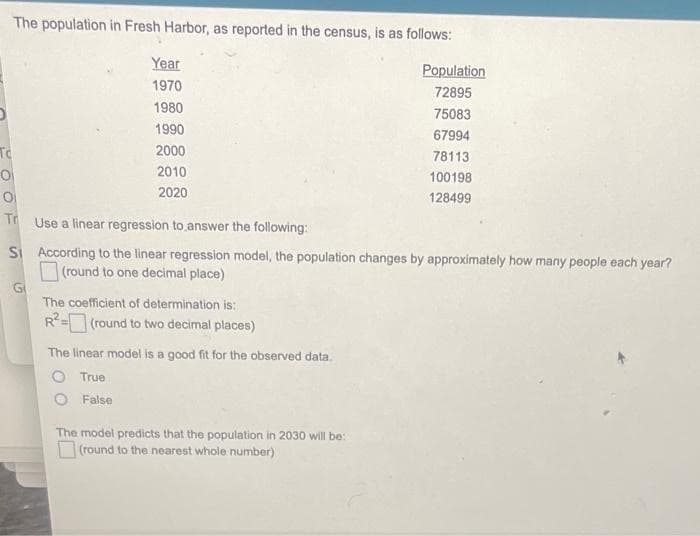
Transcribed Image Text:The population in Fresh Harbor, as reported in the census, is as follows:
Year
Population
1970
72895
1980
75083
1990
67994
To
2000
78113
2010
100198
2020
128499
Tr
Use a linear regression to answer the following:
SI According to the linear regression model, the population changes by approximately how many people each year?
(round to one decimal place)
Gi
The coefficient of determination is:
R-(round to two decimal places)
The linear model is a good fit for the observed data.
O True
False
The model predicts that the population in 2030 will be:
O (round to the nearest whole number)
Expert Solution
This question has been solved!
Explore an expertly crafted, step-by-step solution for a thorough understanding of key concepts.

This is a popular solution!

Trending now
This is a popular solution!

Step by step
Solved in 2 steps with 1 images

Recommended textbooks for you
Functions and Change: A Modeling Approach to Coll…
Algebra
ISBN:
9781337111348
Author:
Bruce Crauder, Benny Evans, Alan Noell
Publisher:
Cengage Learning

Glencoe Algebra 1, Student Edition, 9780079039897…
Algebra
ISBN:
9780079039897
Author:
Carter
Publisher:
McGraw Hill

College Algebra
Algebra
ISBN:
9781305115545
Author:
James Stewart, Lothar Redlin, Saleem Watson
Publisher:
Cengage Learning
Functions and Change: A Modeling Approach to Coll…
Algebra
ISBN:
9781337111348
Author:
Bruce Crauder, Benny Evans, Alan Noell
Publisher:
Cengage Learning
Glencoe Algebra 1, Student Edition, 9780079039897…
Algebra
ISBN:
9780079039897
Author:
Carter
Publisher:
McGraw Hill
College Algebra
Algebra
ISBN:
9781305115545
Author:
James Stewart, Lothar Redlin, Saleem Watson
Publisher:
Cengage Learning

Algebra and Trigonometry (MindTap Course List)
Algebra
ISBN:
9781305071742
Author:
James Stewart, Lothar Redlin, Saleem Watson
Publisher:
Cengage Learning
