In a study of cell phone use and brain hemispheric dominance, an Internet survey was emailed to 5000 subjects randomly selected from an online group involved with ears. 717 returned. Use a 0.01 significance level to test the claim that the return rate is less than 15%. • What is the critical value? A. -2.33 В. -1.645 C. -1.96 D. -1.44 • What is the test statistic and conclusion? A. -0.91; Reject Ho B. -0.91; Fail to reject Ho C. -1.31; Reject Họ D. -1.31; Fail to reject Ho
In a study of cell phone use and brain hemispheric dominance, an Internet survey was emailed to 5000 subjects randomly selected from an online group involved with ears. 717 returned. Use a 0.01 significance level to test the claim that the return rate is less than 15%. • What is the critical value? A. -2.33 В. -1.645 C. -1.96 D. -1.44 • What is the test statistic and conclusion? A. -0.91; Reject Ho B. -0.91; Fail to reject Ho C. -1.31; Reject Họ D. -1.31; Fail to reject Ho

MATLAB: An Introduction with Applications
6th Edition
ISBN:9781119256830
Author:Amos Gilat
Publisher:Amos Gilat
Chapter1: Starting With Matlab
Section: Chapter Questions
Problem 1P

Related questions
Question
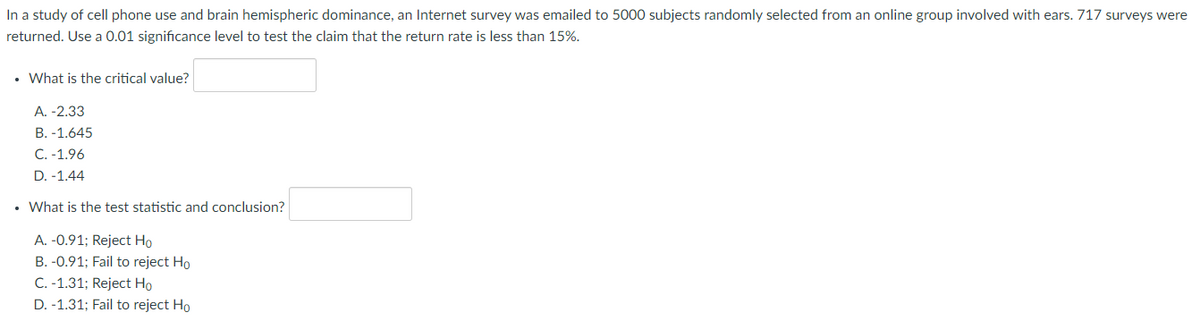
Transcribed Image Text:In a study of cell phone use and brain hemispheric dominance, an Internet survey was emailed to 5000 subjects randomly selected from an online group involved with ears. 717 surveys were
returned. Use a 0.01 significance level to test the claim that the return rate is less than 15%.
• What is the critical value?
A. -2.33
B. -1.645
C. -1.96
D. -1.44
• What is the test statistic and conclusion?
A. -0.91; Reject Ho
B. -0.91; Fail to reject Ho
C. -1.31; Reject Ho
D. -1.31; Fail to reject Ho
Expert Solution
This question has been solved!
Explore an expertly crafted, step-by-step solution for a thorough understanding of key concepts.

This is a popular solution!

Trending now
This is a popular solution!

Step by step
Solved in 2 steps

Recommended textbooks for you
MATLAB: An Introduction with Applications
Statistics
ISBN:
9781119256830
Author:
Amos Gilat
Publisher:
John Wiley & Sons Inc

Probability and Statistics for Engineering and th…
Statistics
ISBN:
9781305251809
Author:
Jay L. Devore
Publisher:
Cengage Learning

Statistics for The Behavioral Sciences (MindTap C…
Statistics
ISBN:
9781305504912
Author:
Frederick J Gravetter, Larry B. Wallnau
Publisher:
Cengage Learning
MATLAB: An Introduction with Applications
Statistics
ISBN:
9781119256830
Author:
Amos Gilat
Publisher:
John Wiley & Sons Inc
Probability and Statistics for Engineering and th…
Statistics
ISBN:
9781305251809
Author:
Jay L. Devore
Publisher:
Cengage Learning
Statistics for The Behavioral Sciences (MindTap C…
Statistics
ISBN:
9781305504912
Author:
Frederick J Gravetter, Larry B. Wallnau
Publisher:
Cengage Learning

Elementary Statistics: Picturing the World (7th E…
Statistics
ISBN:
9780134683416
Author:
Ron Larson, Betsy Farber
Publisher:
PEARSON

The Basic Practice of Statistics
Statistics
ISBN:
9781319042578
Author:
David S. Moore, William I. Notz, Michael A. Fligner
Publisher:
W. H. Freeman

Introduction to the Practice of Statistics
Statistics
ISBN:
9781319013387
Author:
David S. Moore, George P. McCabe, Bruce A. Craig
Publisher:
W. H. Freeman