13 12- 11 D = MSB 30 40 50 60 70 Paper (millions of tons per year) e graph above shows the supply, demand, and marginal social cost curves in the per market. There is a negative externality in the production of paper due to llution. regulate this externality optimally, the government would want to -- production dollars per ton. tax; 2 Price (dollars per ton a 4.
13 12- 11 D = MSB 30 40 50 60 70 Paper (millions of tons per year) e graph above shows the supply, demand, and marginal social cost curves in the per market. There is a negative externality in the production of paper due to llution. regulate this externality optimally, the government would want to -- production dollars per ton. tax; 2 Price (dollars per ton a 4.

Chapter3: Economic Decision Makers
Section: Chapter Questions
Problem 3.12P

Related questions
Question
Solve it correctly when you know complete solution not the wrong
Transcribed Image Text:S = MC
14
13
12
11
D = MSB
30
40
50
60
70
Paper (millions of tons per year)
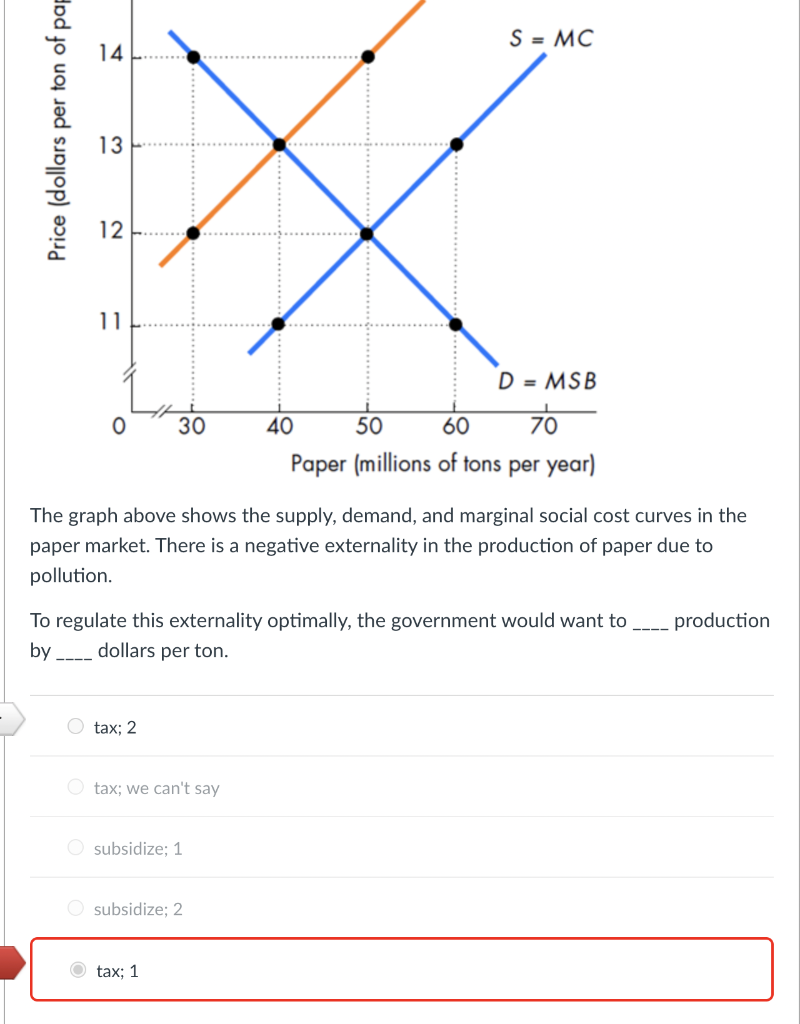
The graph above shows the supply, demand, and marginal social cost curves in the
paper market. There is a negative externality in the production of paper due to
pollution.
To regulate this externality optimally, the government would want to
production
by
dollars per ton.
----
O tax; 2
O tax; we can't say
O subsidize; 1
O subsidize; 2
O tax; 1
Price (dollars per ton of pap
Expert Solution
This question has been solved!
Explore an expertly crafted, step-by-step solution for a thorough understanding of key concepts.

Step by step
Solved in 4 steps

Knowledge Booster


Learn more about
Need a deep-dive on the concept behind this application? Look no further. Learn more about this topic, economics and related others by exploring similar questions and additional content below.Recommended textbooks for you


Managerial Economics: Applications, Strategies an…
Economics
ISBN:
9781305506381
Author:
James R. McGuigan, R. Charles Moyer, Frederick H.deB. Harris
Publisher:
Cengage Learning
Managerial Economics: Applications, Strategies an…
Economics
ISBN:
9781305506381
Author:
James R. McGuigan, R. Charles Moyer, Frederick H.deB. Harris
Publisher:
Cengage Learning

Principles of Economics 2e
Economics
ISBN:
9781947172364
Author:
Steven A. Greenlaw; David Shapiro
Publisher:
OpenStax

Economics (MindTap Course List)
Economics
ISBN:
9781337617383
Author:
Roger A. Arnold
Publisher:
Cengage Learning
