13. According to the 68%-95%-99.70% rule, the standard deviation and mean interval that covers approximately 99.70% of the data from a frequency distribution is_ A. 2u ± 20 14. The first quarterly assessment result of Grade 11- STEM students in their Statistics and Probability subject had scored with a mean of 40 and a standar deviation of 8. A histogram of the data shows that the distribution is normal. Use the Empirical Rule to find the percentage of scores between 24 and 48. B. uto C. u± 20 D. μ1 30 12. 5% B 68% C 81 5% D 95%
13. According to the 68%-95%-99.70% rule, the standard deviation and mean interval that covers approximately 99.70% of the data from a frequency distribution is_ A. 2u ± 20 14. The first quarterly assessment result of Grade 11- STEM students in their Statistics and Probability subject had scored with a mean of 40 and a standar deviation of 8. A histogram of the data shows that the distribution is normal. Use the Empirical Rule to find the percentage of scores between 24 and 48. B. uto C. u± 20 D. μ1 30 12. 5% B 68% C 81 5% D 95%

MATLAB: An Introduction with Applications
6th Edition
ISBN:9781119256830
Author:Amos Gilat
Publisher:Amos Gilat
Chapter1: Starting With Matlab
Section: Chapter Questions
Problem 1P

Related questions
Question
Solve for the following
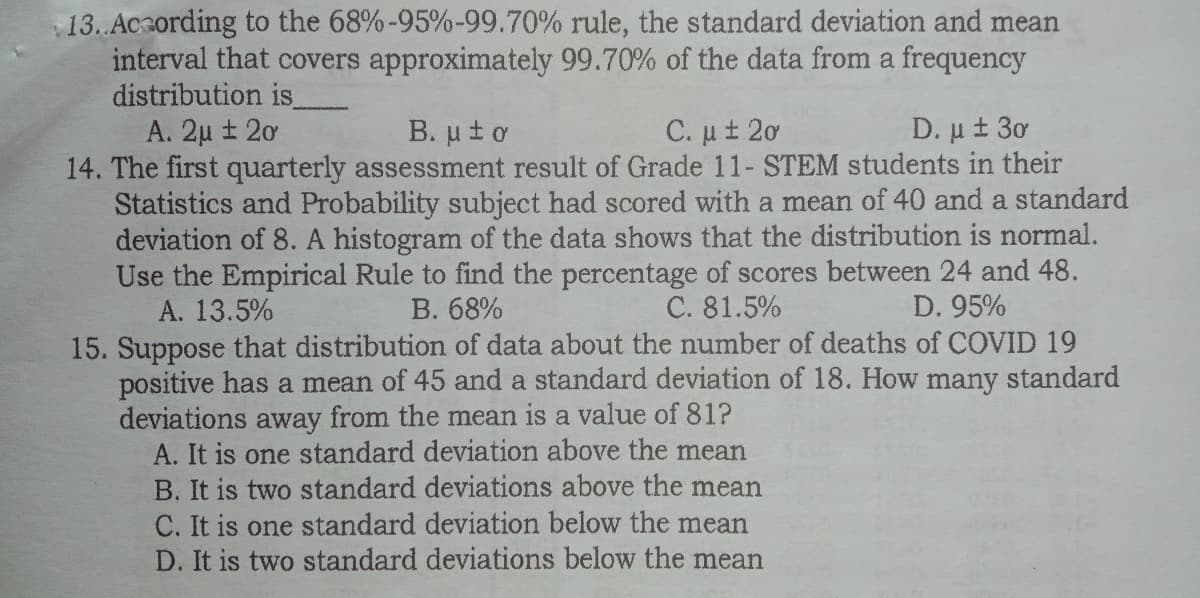
Transcribed Image Text:13. Acording to the 68%-95%-99.70% rule, the standard deviation and mean
interval that covers approximately 99.70% of the data from a frequency
distribution is
A. 2µ ± 20
14. The first quarterly assessment result of Grade 11- STEM students in their
Statistics and Probability subject had scored with a mean of 40 and a standard
deviation of 8. A histogram of the data shows that the distribution is normal.
Use the Empirical Rule to find the percentage of scores between 24 and 48.
A. 13.5%
B. ut o
C. ut 2ơ
D. μ 1 3
B. 68%
C. 81.5%
D. 95%
15. Suppose that distribution of data about the number of deaths of COVID 19
positive has a mean of 45 and a standard deviation of 18. How many standard
deviations
A. It is one standard deviation above the mean
B. It is two standard deviations above the mean
C. It is one standard deviation below the mean
D. It is two standard deviations below the mean
away from the mean is a value of 81?
Expert Solution
This question has been solved!
Explore an expertly crafted, step-by-step solution for a thorough understanding of key concepts.

This is a popular solution!

Trending now
This is a popular solution!

Step by step
Solved in 2 steps

Recommended textbooks for you
MATLAB: An Introduction with Applications
Statistics
ISBN:
9781119256830
Author:
Amos Gilat
Publisher:
John Wiley & Sons Inc

Probability and Statistics for Engineering and th…
Statistics
ISBN:
9781305251809
Author:
Jay L. Devore
Publisher:
Cengage Learning

Statistics for The Behavioral Sciences (MindTap C…
Statistics
ISBN:
9781305504912
Author:
Frederick J Gravetter, Larry B. Wallnau
Publisher:
Cengage Learning
MATLAB: An Introduction with Applications
Statistics
ISBN:
9781119256830
Author:
Amos Gilat
Publisher:
John Wiley & Sons Inc
Probability and Statistics for Engineering and th…
Statistics
ISBN:
9781305251809
Author:
Jay L. Devore
Publisher:
Cengage Learning
Statistics for The Behavioral Sciences (MindTap C…
Statistics
ISBN:
9781305504912
Author:
Frederick J Gravetter, Larry B. Wallnau
Publisher:
Cengage Learning

Elementary Statistics: Picturing the World (7th E…
Statistics
ISBN:
9780134683416
Author:
Ron Larson, Betsy Farber
Publisher:
PEARSON

The Basic Practice of Statistics
Statistics
ISBN:
9781319042578
Author:
David S. Moore, William I. Notz, Michael A. Fligner
Publisher:
W. H. Freeman

Introduction to the Practice of Statistics
Statistics
ISBN:
9781319013387
Author:
David S. Moore, George P. McCabe, Bruce A. Craig
Publisher:
W. H. Freeman