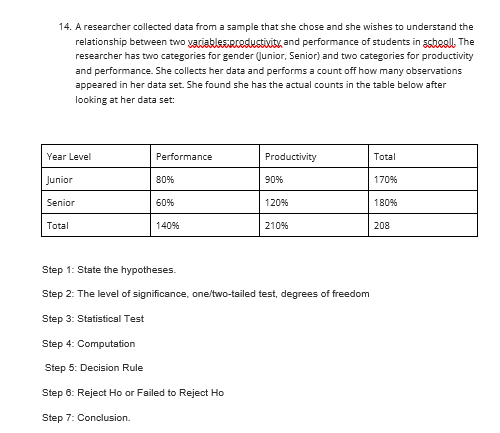
14. A researcher collected data from a sample that she chose and she wishes to understand the relationship between two variable&rcestustivity and performance of students in sheall The researcher has two categories for gender (junior, Senior) and two categories for productivity and performance. She collects her data and performs a count off how many observations appeared in her data set. She found she has the actual counts in the table below after looking at her data set: Year Level Performance Productivity Total Junior 80% 90% 170% Senior 60% 120% 180% Total 140% 210% 208 Step 1: State the hypotheses. Step 2: The level of significance, one/two-tailed test, degrees of freedom Step 3: Statistical Test Step 4: Computation Step 5: Decision Rule Step 6: Reject Ho or Failed to Reject Ho Step 7: Conclusion.
14. A researcher collected data from a sample that she chose and she wishes to understand the relationship between two variable&rcestustivity and performance of students in sheall The researcher has two categories for gender (junior, Senior) and two categories for productivity and performance. She collects her data and performs a count off how many observations appeared in her data set. She found she has the actual counts in the table below after looking at her data set: Year Level Performance Productivity Total Junior 80% 90% 170% Senior 60% 120% 180% Total 140% 210% 208 Step 1: State the hypotheses. Step 2: The level of significance, one/two-tailed test, degrees of freedom Step 3: Statistical Test Step 4: Computation Step 5: Decision Rule Step 6: Reject Ho or Failed to Reject Ho Step 7: Conclusion.

Glencoe Algebra 1, Student Edition, 9780079039897, 0079039898, 2018
18th Edition
ISBN:9780079039897
Author:Carter
Publisher:Carter
Chapter10: Statistics
Section10.5: Comparing Sets Of Data
Problem 26PFA

Related questions
Question
Answer ff
Transcribed Image Text:14. A researcher collected data from a sample that she chose and she wishes to understand the
relationship between two variablercedustivity and performance of students in ssheall. The
researcher has two categories for gender (junior, Senior) and two categories for productivity
and performance. She collects her data and performs a count off how many observations
appeared in her data set. She found she has the actual counts in the table below after
looking at her data set:
Year Level
Performance
Productivity
Total
Junior
80%
90%
170%
Senior
60%
120%
180%
Total
140%
210%
208
Step 1: State the hypotheses.
Step 2: The level of significance, one/two-tailed test, degrees of freedom
Step 3: Statistical Test
Step 4: Computation
Step 5: Decision Rule
Step 6: Reject Ho or Failed to Reject Ho
Step 7: Conclusion.
Expert Solution
This question has been solved!
Explore an expertly crafted, step-by-step solution for a thorough understanding of key concepts.

Step by step
Solved in 3 steps

Recommended textbooks for you
Glencoe Algebra 1, Student Edition, 9780079039897…
Algebra
ISBN:
9780079039897
Author:
Carter
Publisher:
McGraw Hill

Holt Mcdougal Larson Pre-algebra: Student Edition…
Algebra
ISBN:
9780547587776
Author:
HOLT MCDOUGAL
Publisher:
HOLT MCDOUGAL
Glencoe Algebra 1, Student Edition, 9780079039897…
Algebra
ISBN:
9780079039897
Author:
Carter
Publisher:
McGraw Hill
Holt Mcdougal Larson Pre-algebra: Student Edition…
Algebra
ISBN:
9780547587776
Author:
HOLT MCDOUGAL
Publisher:
HOLT MCDOUGAL