14. Application: Demand elasticity and agriculture Consider the market for apples. The following graph shows the weekly demand for apples and the weekly supply of apples. Suppose a blight occurs that destroys a significant portion of apple crops. Show the effect this shock has on the market for apples by shifting the demand curve, supply curve, or both. Note: Select and drag one or both of the curves to the desired position. Curves will snap into position, so if you try to move a curve and it snaps back to its original position, just drag it a little farther. PRICE (Dollars per bushel) 30 24 18 0 0 6 I I 12 18 QUANTITY (Millions of bushels) D2 24 Supply Total Revenue (Millions of Dollars) 30 Demand -- Supply (?) One of the growers is excited by the price increase caused by the blight because he believes it will increase revenue in this market. As an economics student, you can use elasticities to determine whether this change in price will lead to an increase or decrease in total revenue in this market. Using the midpoint method, the price elasticity of demand for apples between the prices of $15 and $21 per bushel is 0.75, which means demand is between these two points. Therefore, you would tell the grower that his claim is , because total revenue ▼as a result of the blight. " will Confirm your previous conclusion by calculating total revenue in the apple market before and after the blight. Enter these values in the following table. Before Blight After Blight
14. Application: Demand elasticity and agriculture Consider the market for apples. The following graph shows the weekly demand for apples and the weekly supply of apples. Suppose a blight occurs that destroys a significant portion of apple crops. Show the effect this shock has on the market for apples by shifting the demand curve, supply curve, or both. Note: Select and drag one or both of the curves to the desired position. Curves will snap into position, so if you try to move a curve and it snaps back to its original position, just drag it a little farther. PRICE (Dollars per bushel) 30 24 18 0 0 6 I I 12 18 QUANTITY (Millions of bushels) D2 24 Supply Total Revenue (Millions of Dollars) 30 Demand -- Supply (?) One of the growers is excited by the price increase caused by the blight because he believes it will increase revenue in this market. As an economics student, you can use elasticities to determine whether this change in price will lead to an increase or decrease in total revenue in this market. Using the midpoint method, the price elasticity of demand for apples between the prices of $15 and $21 per bushel is 0.75, which means demand is between these two points. Therefore, you would tell the grower that his claim is , because total revenue ▼as a result of the blight. " will Confirm your previous conclusion by calculating total revenue in the apple market before and after the blight. Enter these values in the following table. Before Blight After Blight

Essentials of Economics (MindTap Course List)
8th Edition
ISBN:9781337091992
Author:N. Gregory Mankiw
Publisher:N. Gregory Mankiw
Chapter5: Elastic And Its Application
Section: Chapter Questions
Problem 10PA

Related questions
Question
Transcribed Image Text:14. Application: Demand elasticity and agriculture
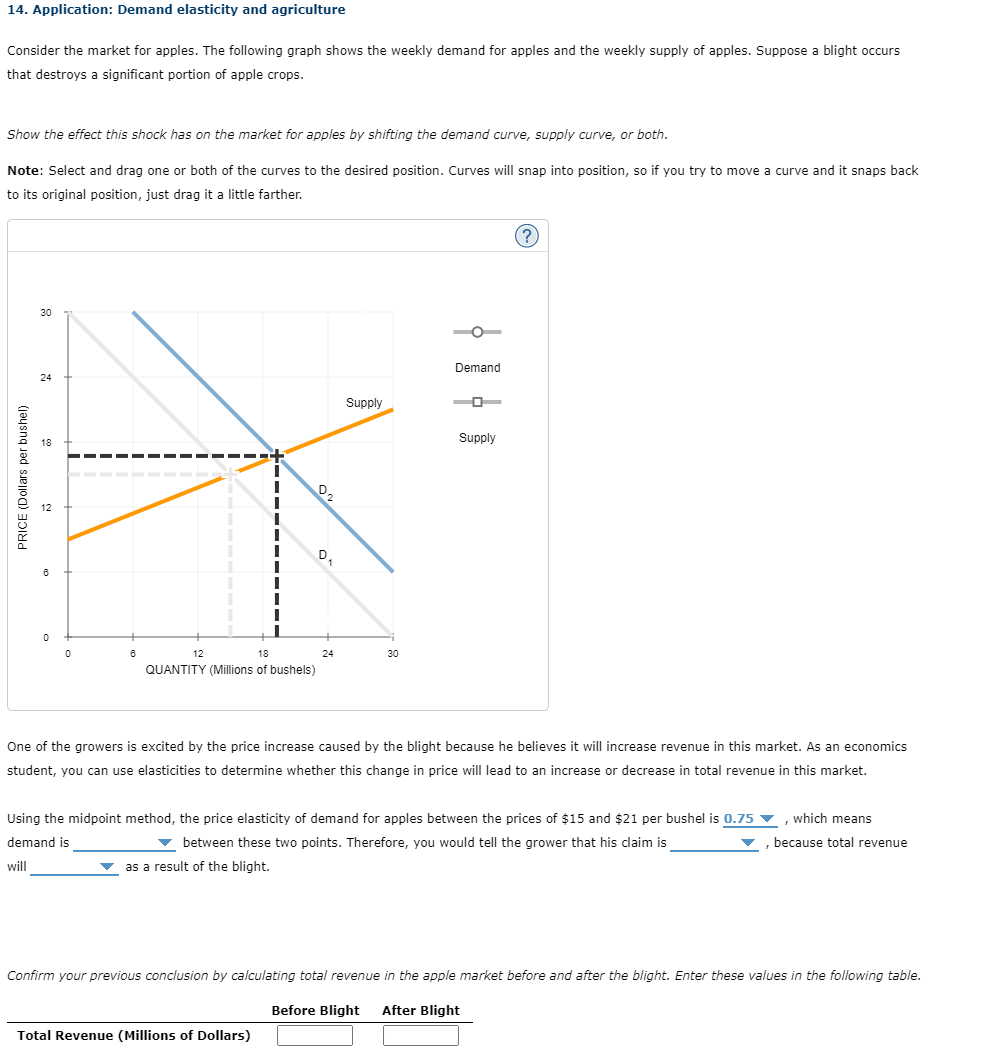
Consider the market for apples. The following graph shows the weekly demand for apples and the weekly supply of apples. Suppose a blight occurs
that destroys a significant portion of apple crops.
Show the effect this shock has on the market for apples by shifting the demand curve, supply curve, or both.
Note: Select and drag one or both of the curves to the desired position. Curves will snap into position, so if you try to move a curve and it snaps back
to its original position, just drag it a little farther.
PRICE (Dollars per bushel)
30
24
18
0
0
6
I
I
12
18
QUANTITY (Millions of bushels)
D2
24
Supply
Total Revenue (Millions of Dollars)
30
Demand
--
Supply
(?)
One of the growers is excited by the price increase caused by the blight because he believes it will increase revenue in this market. As an economics
student, you can use elasticities to determine whether this change in price will lead to an increase or decrease in total revenue in this market.
Using the midpoint method, the price elasticity of demand for apples between the prices of $15 and $21 per bushel is 0.75, which means
demand is
between these two points. Therefore, you would tell the grower that his claim is
, because total revenue
▼as a result of the blight.
"
will
Confirm your previous conclusion by calculating total revenue in the apple market before and after the blight. Enter these values in the following table.
Before Blight After Blight
Expert Solution
This question has been solved!
Explore an expertly crafted, step-by-step solution for a thorough understanding of key concepts.

This is a popular solution!

Trending now
This is a popular solution!

Step by step
Solved in 3 steps with 1 images

Knowledge Booster


Learn more about
Need a deep-dive on the concept behind this application? Look no further. Learn more about this topic, economics and related others by exploring similar questions and additional content below.Recommended textbooks for you
Essentials of Economics (MindTap Course List)
Economics
ISBN:
9781337091992
Author:
N. Gregory Mankiw
Publisher:
Cengage Learning

Principles of Economics, 7th Edition (MindTap Cou…
Economics
ISBN:
9781285165875
Author:
N. Gregory Mankiw
Publisher:
Cengage Learning

Principles of Microeconomics (MindTap Course List)
Economics
ISBN:
9781305971493
Author:
N. Gregory Mankiw
Publisher:
Cengage Learning
Essentials of Economics (MindTap Course List)
Economics
ISBN:
9781337091992
Author:
N. Gregory Mankiw
Publisher:
Cengage Learning
Principles of Economics, 7th Edition (MindTap Cou…
Economics
ISBN:
9781285165875
Author:
N. Gregory Mankiw
Publisher:
Cengage Learning
Principles of Microeconomics (MindTap Course List)
Economics
ISBN:
9781305971493
Author:
N. Gregory Mankiw
Publisher:
Cengage Learning

Principles of Economics (MindTap Course List)
Economics
ISBN:
9781305585126
Author:
N. Gregory Mankiw
Publisher:
Cengage Learning

Principles of Microeconomics
Economics
ISBN:
9781305156050
Author:
N. Gregory Mankiw
Publisher:
Cengage Learning

Principles of Economics 2e
Economics
ISBN:
9781947172364
Author:
Steven A. Greenlaw; David Shapiro
Publisher:
OpenStax